|

GBP/JPY churns on Friday, trying to hang onto 182.00

  • The GBP/JPY sees up-and-down action to cap off the trading week.
  • Japan inflation continues to weaken, UK sees upside GDP surprise.
  • Next week sees little of note on the economic calendar for both the GBP and JPY.

The GBP/JPY is trying to hang onto territory just north of the 182.00 handle, scrambling for a foothold near 182.25 after reaching a Friday peak of 183.00 on UK data beats.

The UK chalked in a forecast-beating print for its Gross Domestic Product (GDP) on Friday. UK GDP came in at an annualized 0.6% for the second quarter, above the expected 0.4%.

The GDP beat gave the Pound Sterling (GBP) a lift to Friday's high of 183.02, but a reversal in broad-market risk appetite took the Guppy back into an intraday low near 181.90.

The Japanese Tokyo Consumer Price Index (CPI) for September came in under the previous reading, reaffirming a continued slowdown in Japanese inflation. Japan's Tokyo CPI printed at an annualized 2.8% versus the previous 2.9%. Tokyo Core CPI (inflation excluding food prices) declined faster than expected, printing at 2.5%. Markets forecast a decline to 2.6% versus the previous 2.8%.

Japan's Unemployment Rate also missed the mark, holding steady at 2.7% and flubbing the market forecast decline to 2.6%.

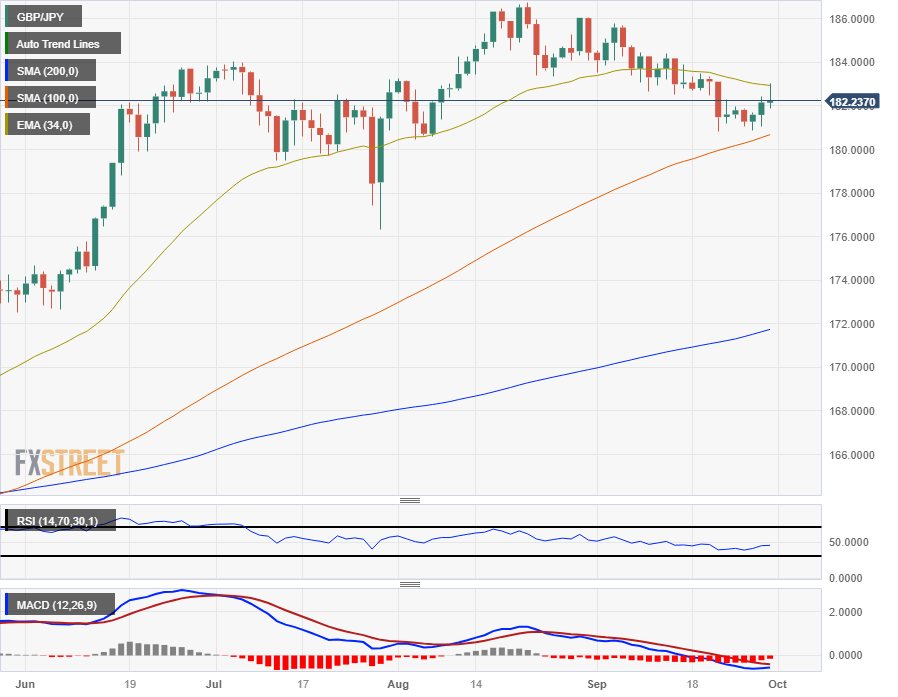
GBP/JPY technical outlook

The GBP/JPY is struggling to keep itself above the 200-hour Simple Moving Average (SMA) currently marked in at the 182.00 handle, and intraday action sees the pair getting hung up on the 34-hour hour Exponential Moving Average (EMA).

Daily candlesticks sees the Guppy hung up between the 34-day EMA and the 100-day SMA at 182.93 and 180.68 respectively.

The pair has seen a slow bleed from August's peaks near 186.77, but still remains firmly in bullish trend territory with the 200-day SMA far below price action near 172.00.

GBP/JPY daily chart

GBP/JPY technical levels

GBP/JPY

Overview
Today last price182.23
Today Daily Change0.07
Today Daily Change %0.04
Today daily open182.16
 
Trends
Daily SMA20183.18
Daily SMA50183.33
Daily SMA100180.55
Daily SMA200171.63
 
Levels
Previous Daily High182.43
Previous Daily Low181.06
Previous Weekly High183.49
Previous Weekly Low180.82
Previous Monthly High186.77
Previous Monthly Low180.46
Daily Fibonacci 38.2%181.91
Daily Fibonacci 61.8%181.58
Daily Pivot Point S1181.34
Daily Pivot Point S2180.52
Daily Pivot Point S3179.97
Daily Pivot Point R1182.7
Daily Pivot Point R2183.25
Daily Pivot Point R3184.07

Author

Joshua Gibson

Joshua joins the FXStreet team as an Economics and Finance double major from Vancouver Island University with twelve years' experience as an independent trader focusing on technical analysis.

More from Joshua Gibson
Share:

Markets move fast. We move first.

Orange Juice Newsletter brings you expert driven insights - not headlines. Every day on your inbox.

By subscribing you agree to our Terms and conditions.

Editor's Picks

EUR/USD stays defensive below 1.1750 as USD finds its feet

EUR/USD kicks off the new week on a softer note, holding below 1.1750 in European trading on Monday. The pair faces challenges due to a pause in the US Dollar downtrend, with traders shifting their focus to the delayed US Nonfarm Payrolls and CPI data for fresh directives. The ECB policy decision is also eagerly awaited. 

GBP/USD holds steady above 1.3350 as traders await key data and BoE

GBP/USD remains on the back foot above 1.3350 in the European session on Monday, though it lacks bearish conviction and holds above the key 200-day SMA support. The US Dollar holds its recovery mode ahead of key data releases, while the Pound Sterling faces headwinds from the expected BoE rate cut this week. 

Gold climbs to seven-week highs on Fed rate cut bets, safe-haven demand

Gold price rises to seven-week highs to near $4,350 during the early European trading hours on Monday. The precious metal extends its upside amid the prospect of interest rate cuts by the US Fed next year. Lower interest rates could reduce the opportunity cost of holding Gold, supporting the non-yielding precious metal.

Solana consolidates as spot ETF inflows near $1 billion signal institutional dip-buying

Solana price hovers above $131 at the time of writing on Monday, nearing the upper boundary of a falling wedge pattern, awaiting a decisive breakout. On the institutional side, demand for spot Solana Exchange-Traded Funds remained firm, pushing total assets under management to nearly $1 billion since launch. 

Big week ends with big doubts

The S&P 500 continued to push higher yesterday as the US 2-year yield wavered around the 3.50% mark following a Federal Reserve (Fed) rate cut earlier this week that was ultimately perceived as not that hawkish after all. The cut is especially boosting the non-tech pockets of the market.

Solana Price Forecast: SOL consolidates as spot ETF inflows near $1 billion signal institutional dip-buying

Solana (SOL) price hovers above $131 at the time of writing on Monday, nearing the upper boundary of a falling wedge pattern, awaiting a decisive breakout.