|

GBP/CAD Price Forecast: Breaks back above legacy trendline as trend turns higher

  • GBP/CAD rises back above an old trendline and extends its rally. 
  • The pair extends its rally within a medium and long-term rising channel.

GBP/CAD looks like it has bottomed out and is once more rising within a broader rising channel. 

The pair was falling in a down leg, however, it has probably reversed and started a new uptrend. Given the principle that “the trend is your friend” the odds favor more upside to come. 

GBP/CAD 4-hour Chart 

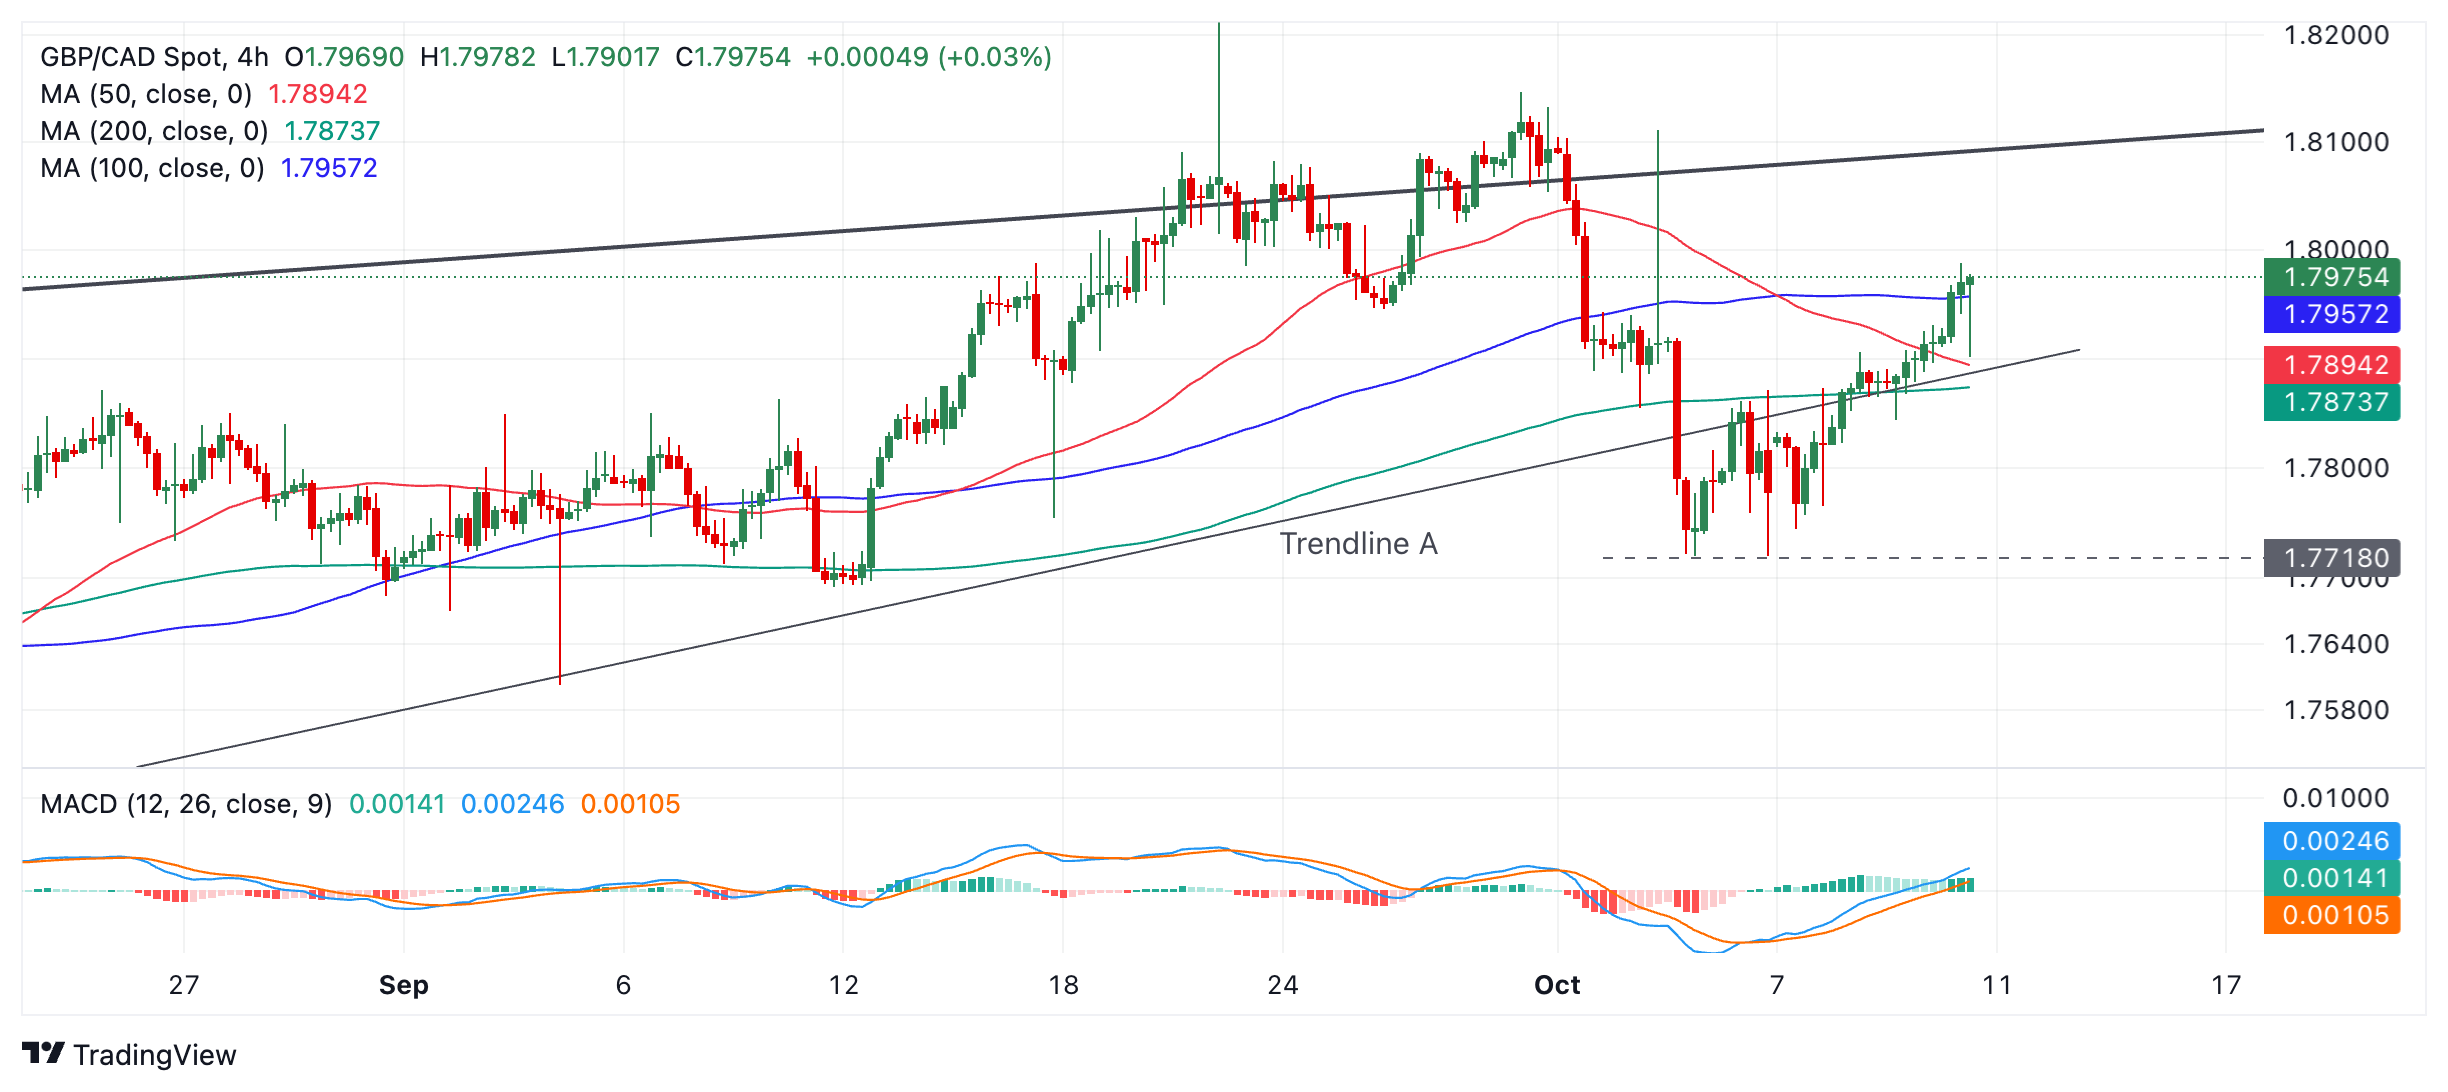
Although the pair broke below an important trendline (“Trendline A” on chart) on October 3. It quickly bottomed out and has since recovered. Now it has also broken back above the same trendline, reversing the short-term downtrend in the process.

The Moving Average Convergence Divergence (MACD) indicator is now above the zero line adding further bullish evidence to the chart. 

GBP/CAD is further supported by the fact that it is in medium and longer-term uptrending cycles.

Author

Joaquin Monfort

Joaquin Monfort is a financial writer and analyst with over 10 years experience writing about financial markets and alt data. He holds a degree in Anthropology from London University and a Diploma in Technical analysis.

More from Joaquin Monfort
Share:

Editor's Picks

AUD/USD eyes 0.7150 barrier nine-day EMA

AUD/USD inches higher after registering modest losses in the previous day, trading around 0.7130 during the Asian hours. The technical analysis of the daily chart indicates that the pair is moving sideways within the rectangle pattern, suggesting a consolidation as neither the bulls nor the bears have enough momentum to take control of the market.

USD/JPY trades below 160.00 intervention threshold; bullish bias intact

The USD/JPY pair attracts some sellers during the Asian session amid fears that authorities will step in again to prop up the Japanese Yen. Furthermore, the Israel-Lebanon truce prompts some profit-taking around the US Dollar and exerts downward pressure on the currency pair.

Gold defends 200-day SMA at $4,425, but for how long?

Gold is attempting a tepid recovery toward $4,500 early Thursday, as renewed optimism in the Mideast geopolitical front calms market nerves. This cautious optimism across Asian markets weighs on Oil prices, and diminishes the US Dollar’s safe-haven appeal, helping Gold stage a decent comeback from the weekly low of $4,424.


Hyperliquid: ETF demand, capital rotation fuel HYPE rally as Bitcoin melts

Hyperliquid price sustains an upward trend near its all-time high of $75.76 on Thursday after posting 80% gains in May, while Bitcoin (BTC) retraces below $65,000, triggering a market-wide panic.

Kevin Warsh takes the Fed helm: What it means for the US Dollar
The Federal Reserve moves away from the highly predictable "forward guidance" model of the Jerome Powell era to a new “Kevin Warsh environment”, characterized by less communication, more policy surprises, and an increased focus on the Fed's complex balance sheet.
Recession on paper: What really moves the Canadian Loonie now?

Statistics Canada handed the headline writers a gift and the analysts a headache. Real GDP shrank 0.1% on an annualized basis in the first quarter, and with the fourth quarter of 2025 revised down to a 1.0% contraction, that is two negative quarters in a row, the textbook definition of a technical recession and Canada's first since the pandemic.