GBP/CAD Price Analysis: A delve into the unknown, but 1.6950/00 is key resistance, bears eye 1.6830/40s
- GBP/CAD bears are beating down the gates towards a test of territories below 1.69 the figure.
- The hourly chart is in consolidation and the bears will need to commit to 1.6950/00 or face a prolonged daily correction.
As per the prior analysis from Tuesday's Asian session, GBP/CAD Price Analysis: Bears are moving in to target 1.69 the figure, the pair has reached the target area, but according to the longer-term time frames, this move may have only just started.
GBP/CAD prior analysis
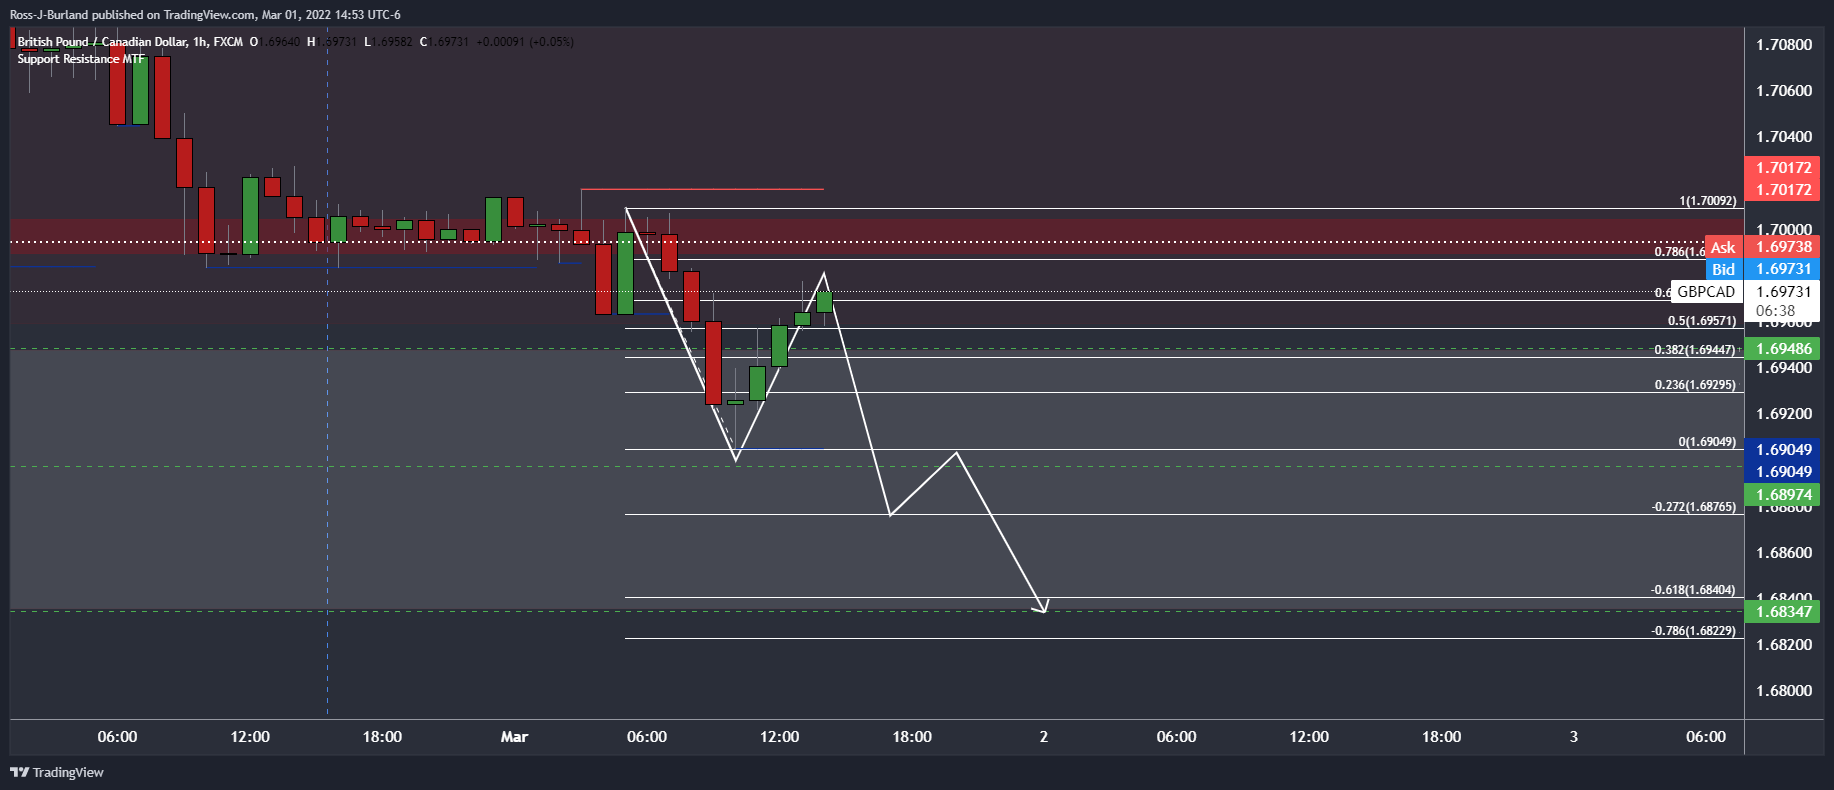
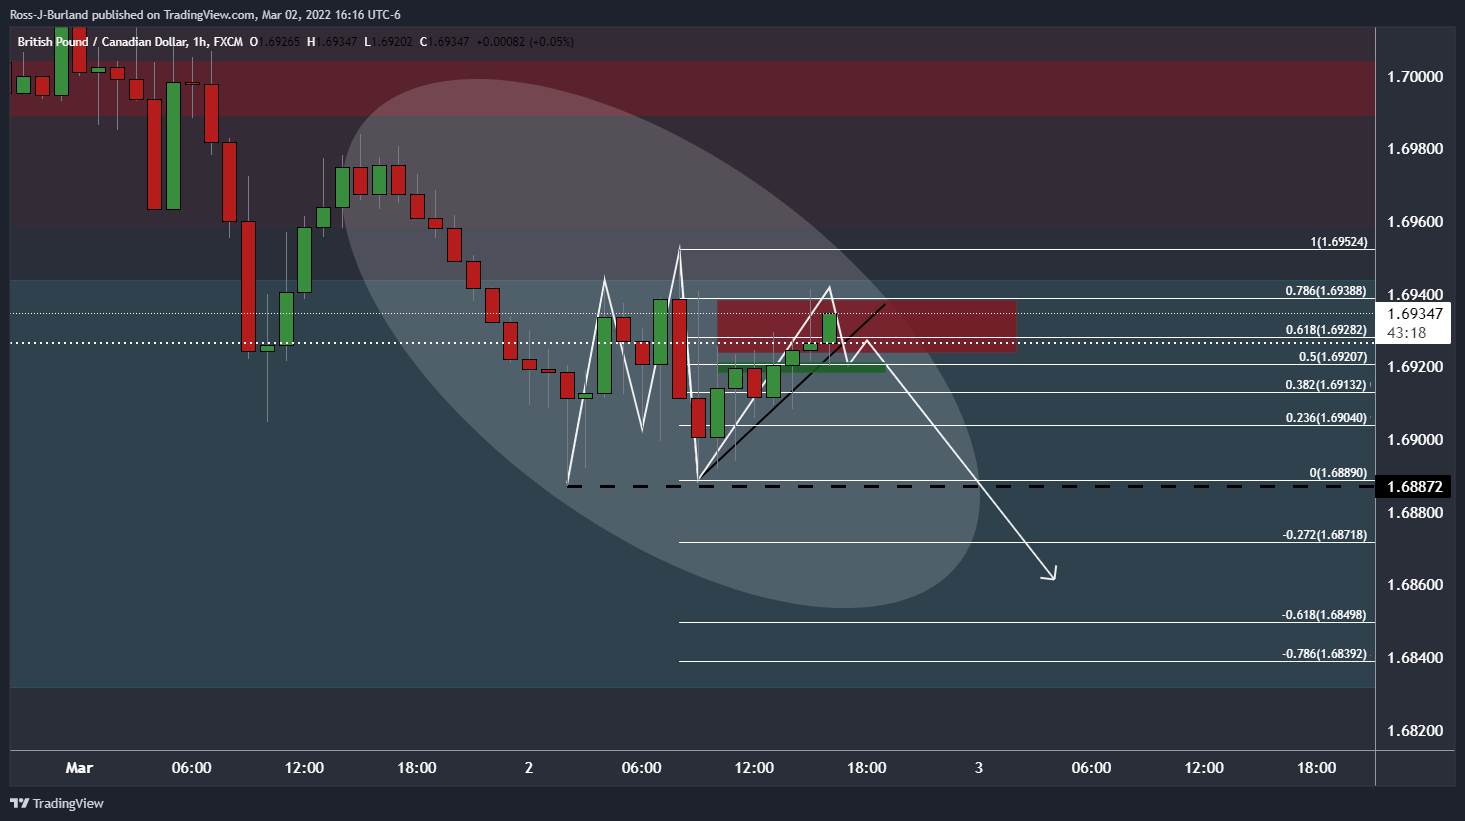
''On the hourly chart, the price is reaching up into the 61.8% golden ratio territory. Should this hold as resistance, then the focus will be on the downside for a test and break of the lows for the sessions ahead. A break below 1.69 the figure opens risk to the 1.6830s daily target as illustrated above.''
''The price has stalled at the forecasted area near the 61.8% ratio and is now starting to form a bearish bias on the hourly time frame.''
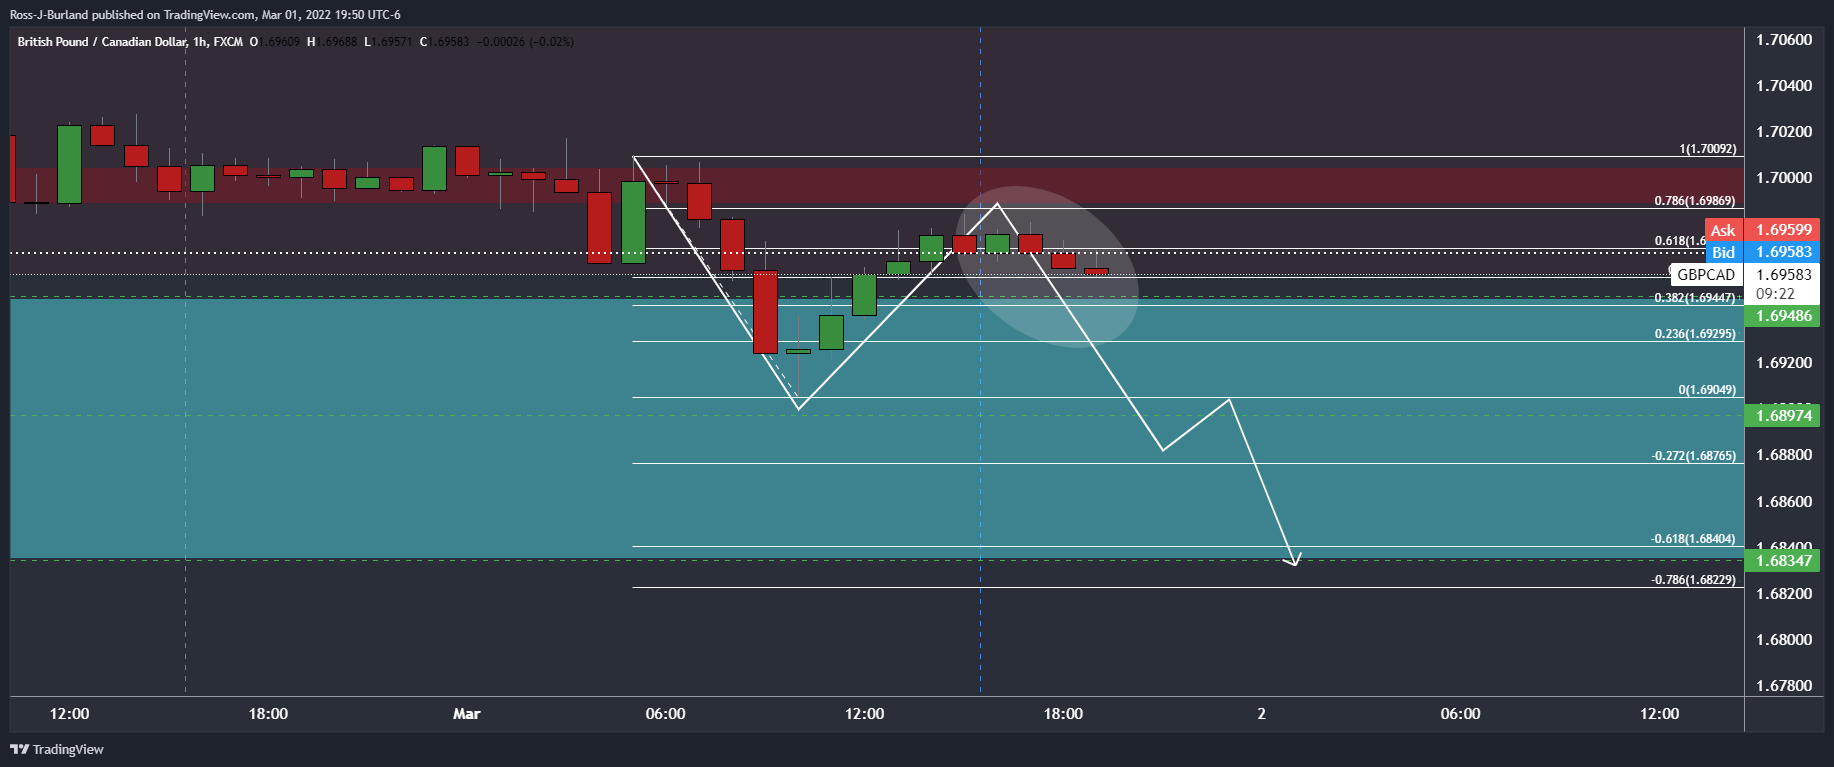
GBP/CAD live market
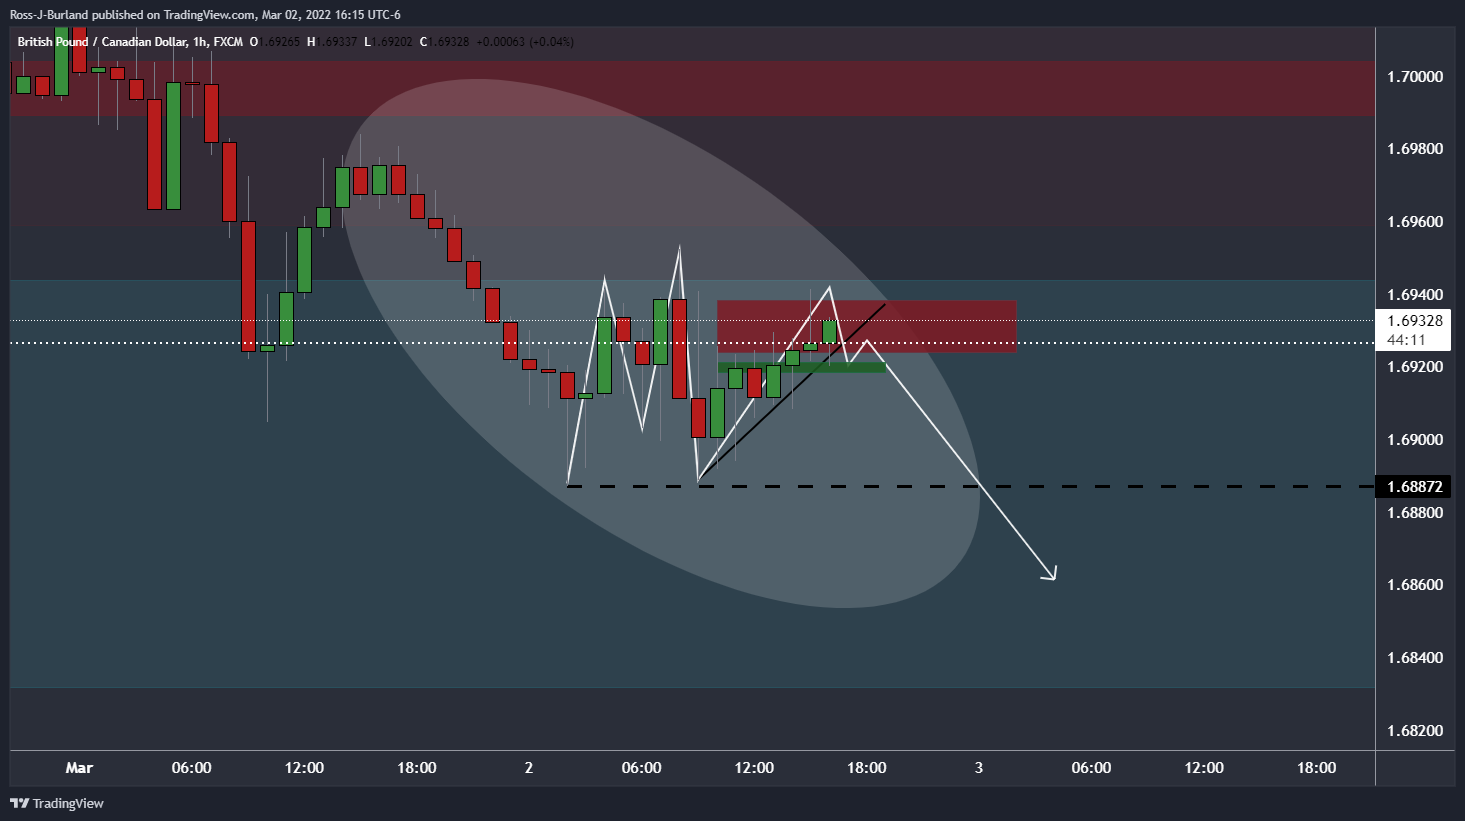
As illustrated, the price reached the target area and has since started to correct. The correction has been volatile but so long as bears hold the fort around the neckline of the M-formation, pressures would be expected to mount leading to a downside continuation.
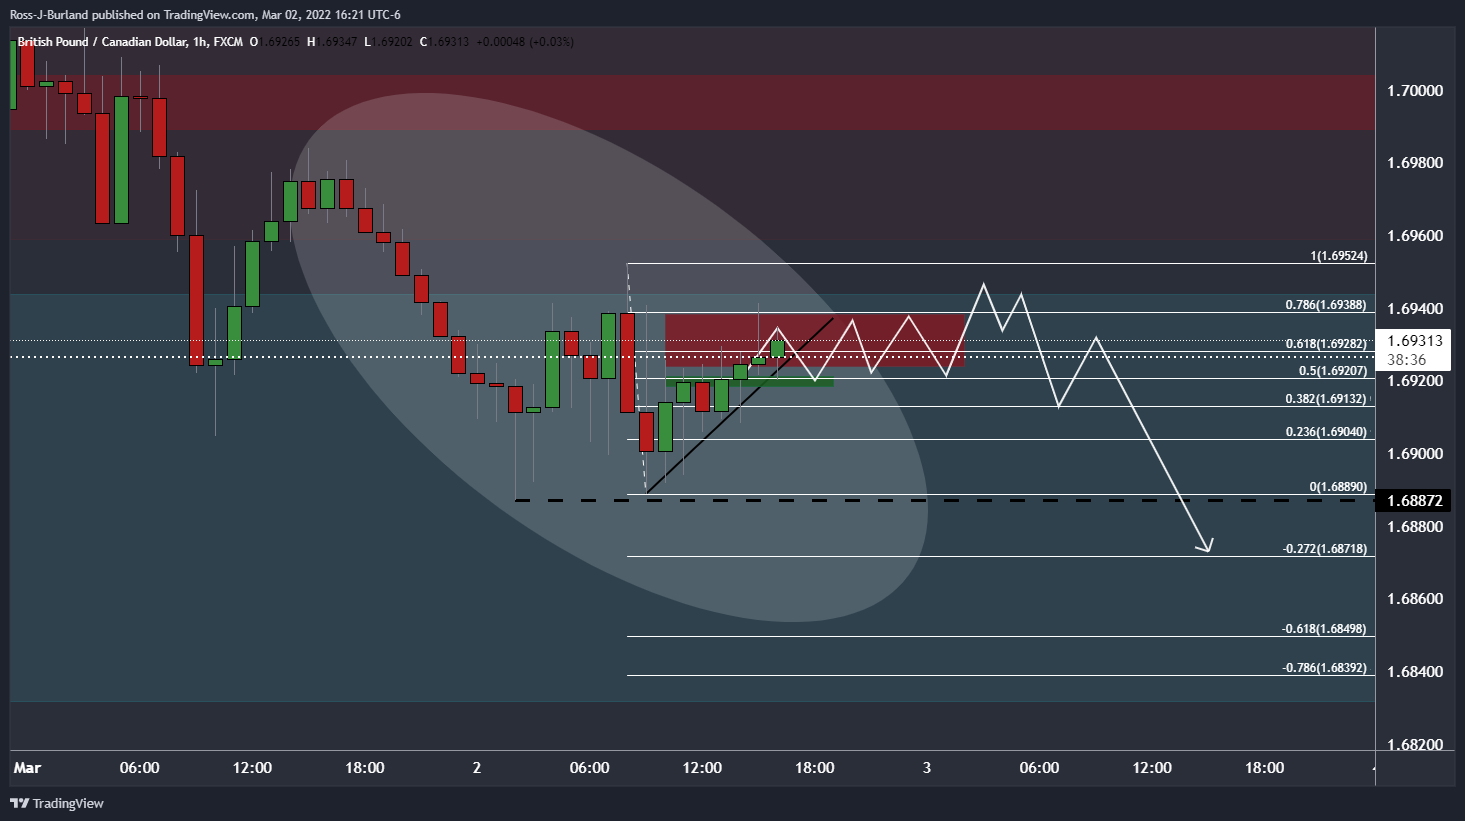
With that being said, the price is making a strong advance towards the 78.6% Fibonacci retracement level having broken the 50% mean reversion level at 1.6920. 1.6920 could act as a firm support. This could potentially lead to some further consolidation above it for the sessions ahead before a potential downside continuation.
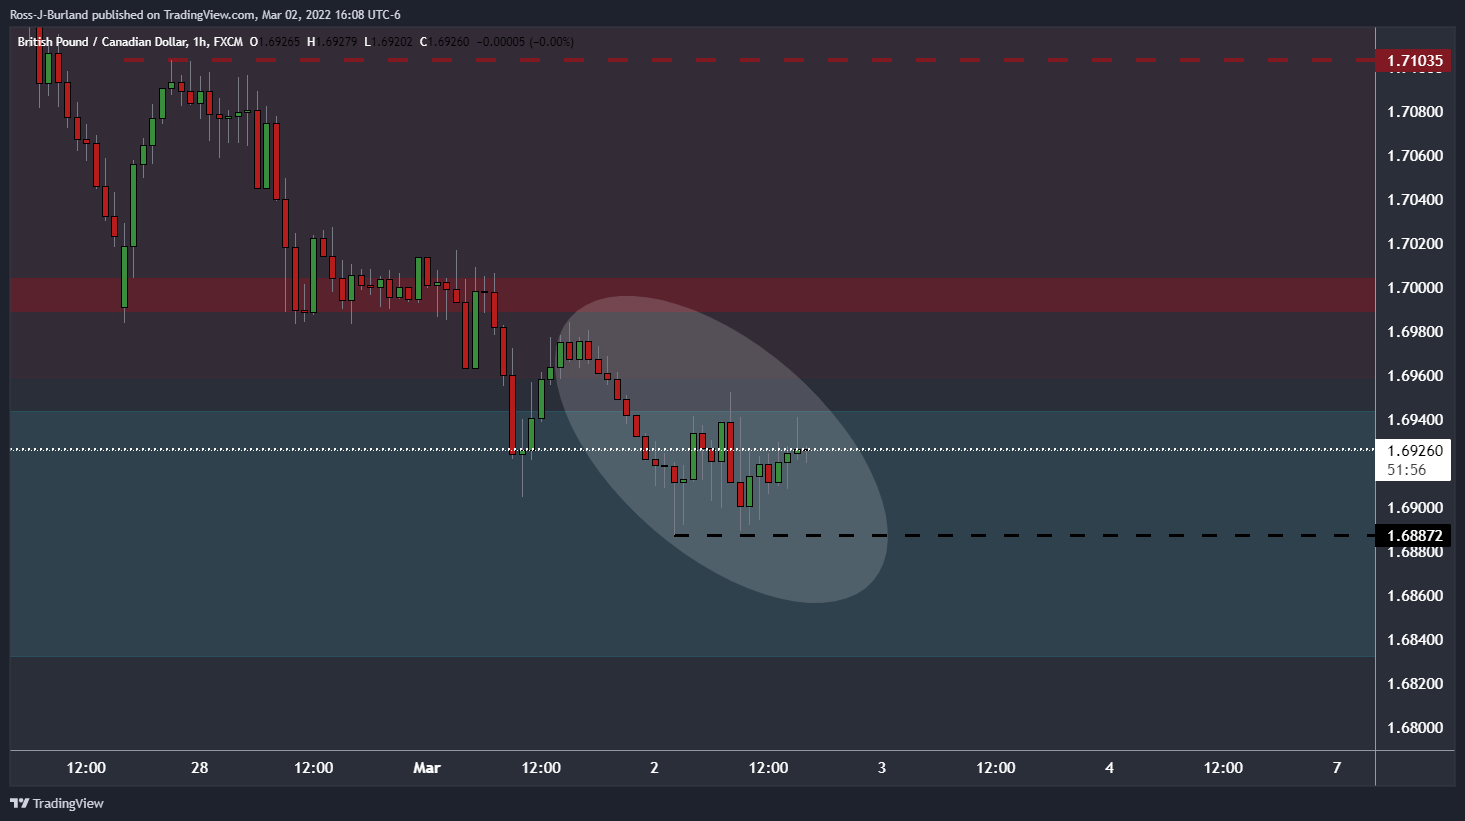
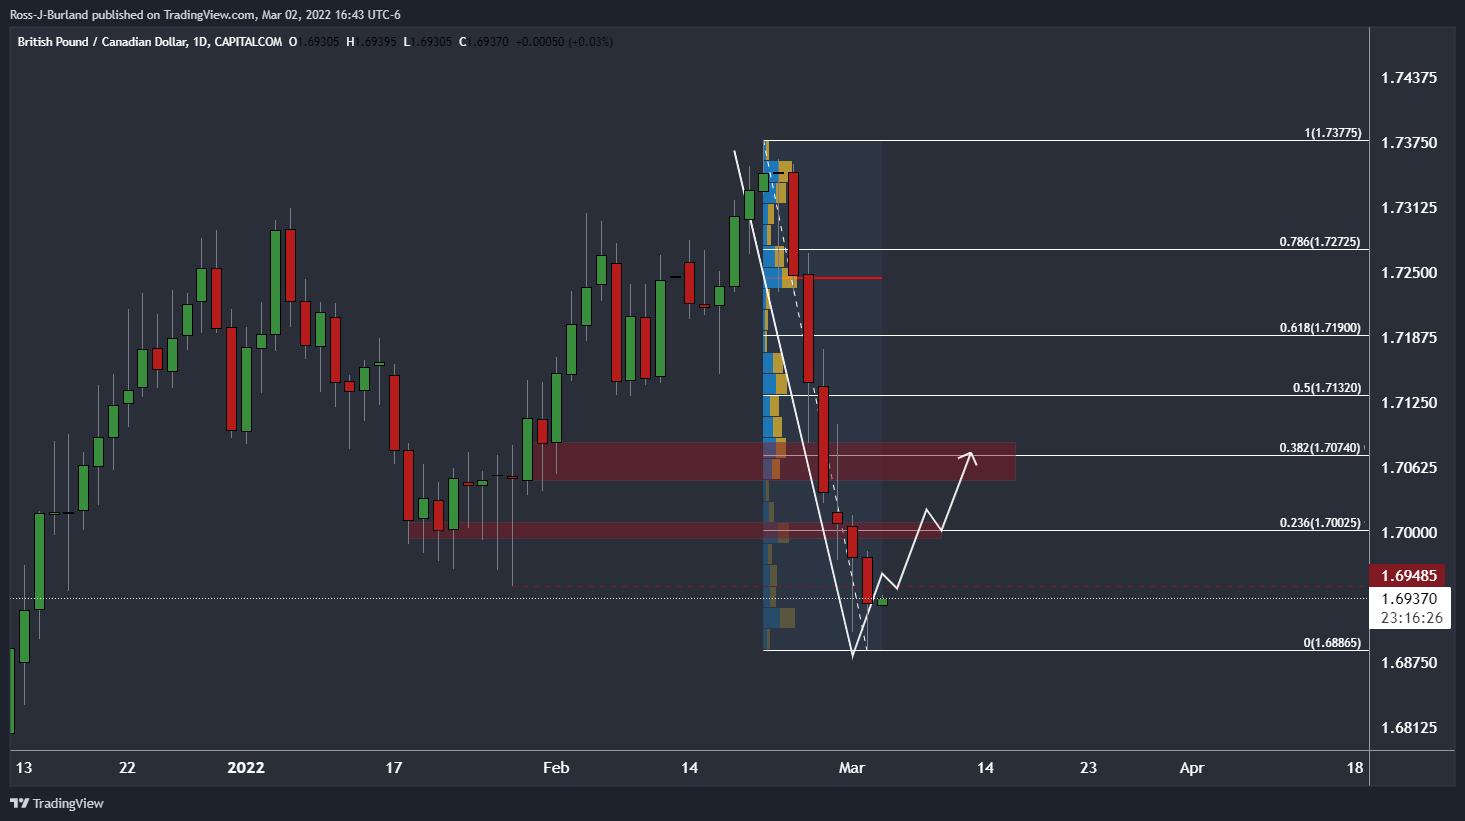
GBP/CAD daily chart
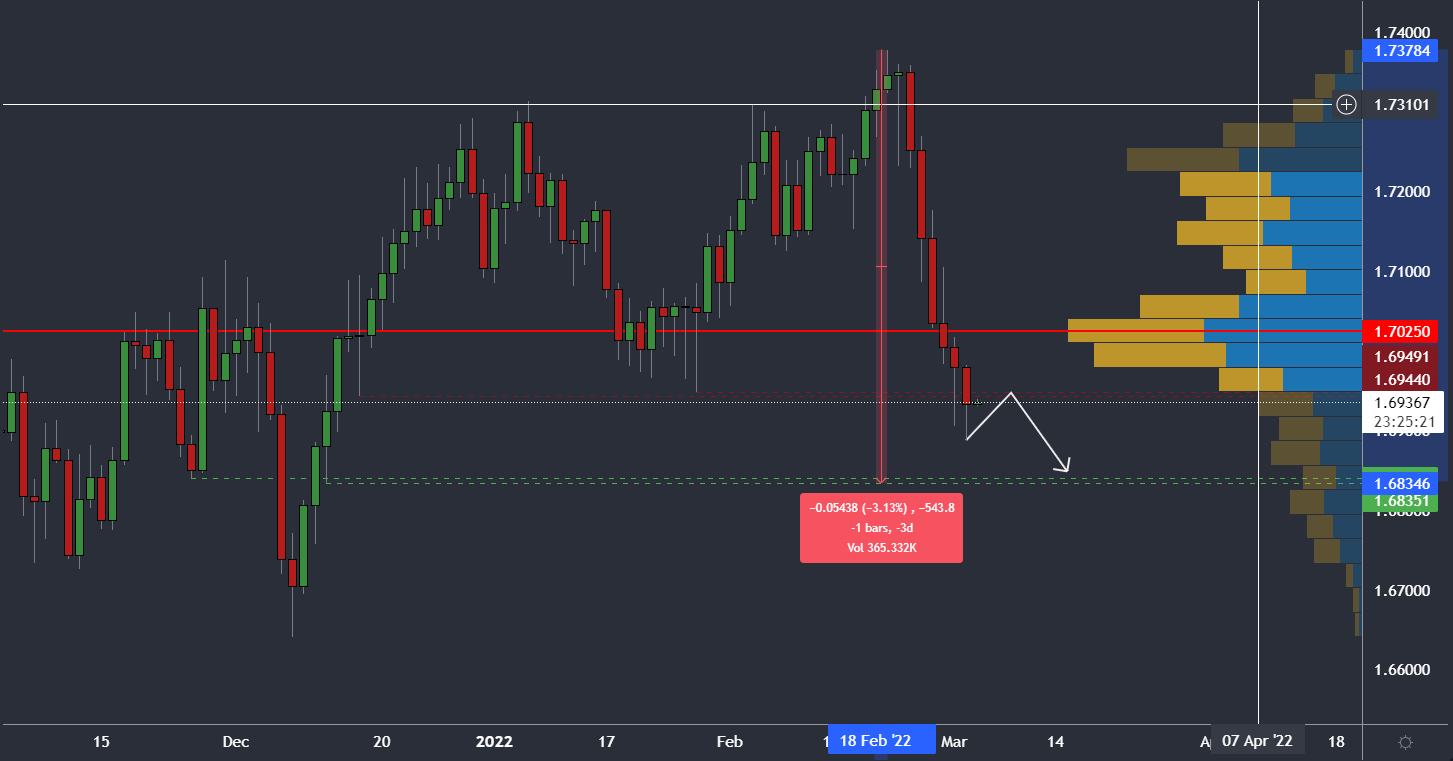
GBP/CAD is known for its lengthy trends of between 550 and 650 pips before there is any meaningful correction. The current daily trend is around 490 so far. Could there be more to go still? The hourly thesis illustrated above are based on the potential for more given the strength and momentum of this bullish impulse that has smashed through 1.7025 was regarded as a potentially strong level of support. 1.6940/50s were next as prior daily wick lows. These too have been left for dust. Ib bears commit to the trend, this could go quite a way further with 1.6840/30 eyed. In such a move, this would put the impulse on par with recent trends in terms of pips.
GBP/USD H4 chart
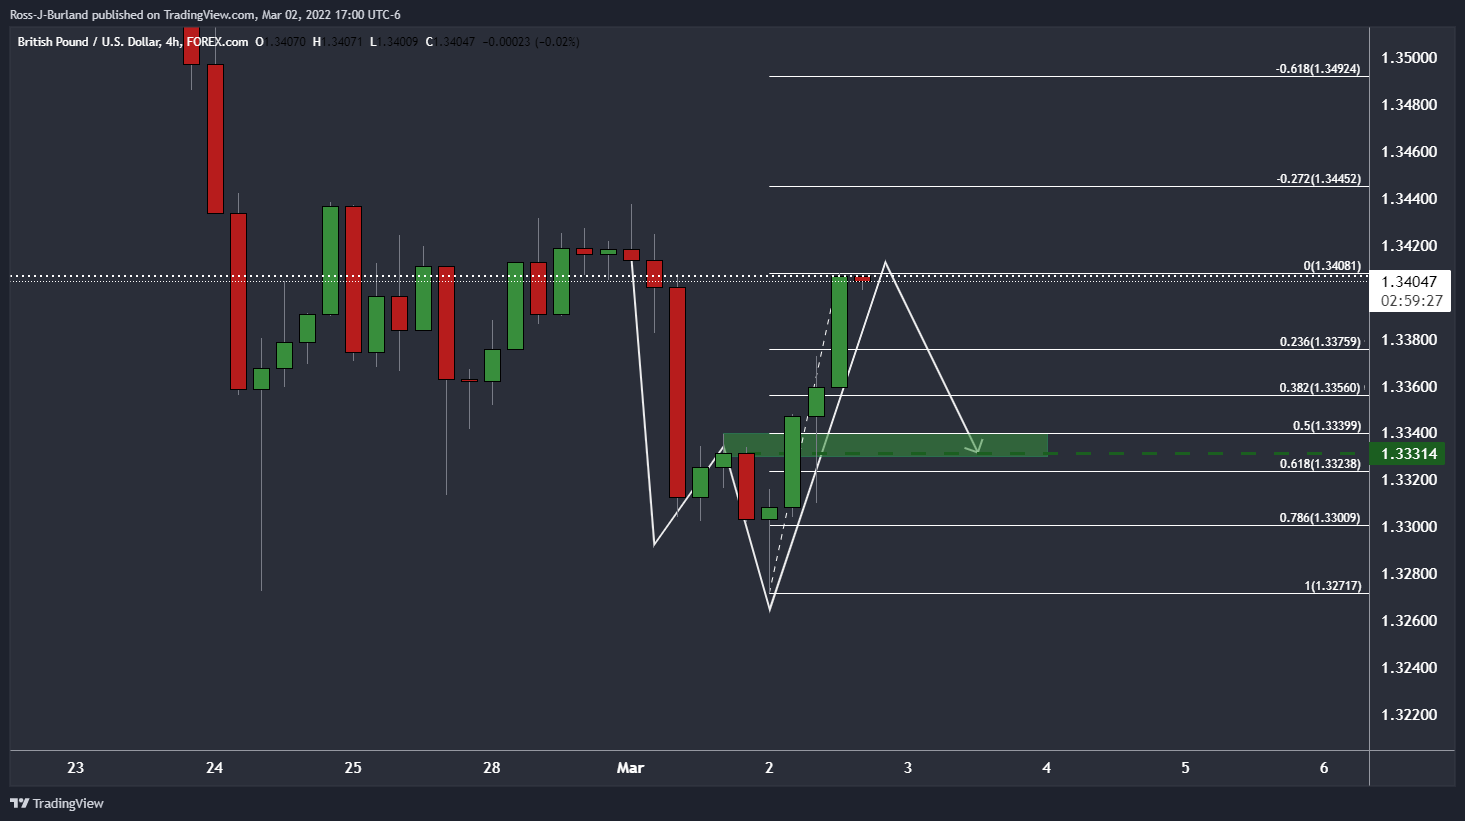
The cable chart is bearish, at least from this resistance and top the neckline of the W-formation that meets the 50% mean reversion level in the 1.3330s. This would be expected to weigh on GBP/CAD. Combining that with higher oil prices and commodities in general, GBP/CAD's path of least resistance can still be lower.
GBP/CAD daily chart
On the other hand, if the bulls manage to overcome 1.6950 and then 1.7000, in this hourly correction, there could be a significant correction on the daily charts to follow:
Author

Ross J Burland
FXStreet
Ross J Burland, born in England, UK, is a sportsman at heart. He played Rugby and Judo for his county, Kent and the South East of England Rugby team.


