FuboTV Stock Price: 13% spike pushes FUBO above 20-week moving average
- FUBO shares blasted past the 20-week SMA on June 7.
- In May FuboTV was down 76.5% from its all-time high in December 2020.
- FuboTV streaming app was attached to LG Electronics's smart TV platform last week.

Sports streaming platform FuboTV (NYSE: FUBO) confirmed a bullish move on Monday, June 7, after closing up nearly 13%. The move follows four weeks of higher weekly closes, with yesterday’s move assuring bulls the party will continue after the stock surmounted the 20-week Simple Moving Average (SMA).
FUBO technical analysis: Shares approaching March resistance
Closing at $30.46 on Monday, bulls will now eye the top of the supply zone at $34.14 from the brief swing high in early March. If they can push the price above here, the next resistance level is the mid-March high of $34.72. There is some evidence that the price may continue to rise. The Relative Strength Index (RSI) is, at the time of writing, above the midpoint at 56 even after a full month of demonstrated strong green candlesticks.
-
NIO Stock News and Forecast: Bullish wedge breakout targets $54.86 as Citi counts on 50% upside
-
S&P 500 Index opens near last week's closing level above 4,200
Management’s announcement on June 4 that their subscription entertainment streaming app would now appear on LG Electronics’ smart TV platform catapulted FUBO shares higher, helping it to breeze past resistance below $30. With LG TVs popularity in the US, observers think that FuboTV’s inclusion will help the company meet its 100% YoY goal of raising revenue to approximately $525 million for the full year 2021.
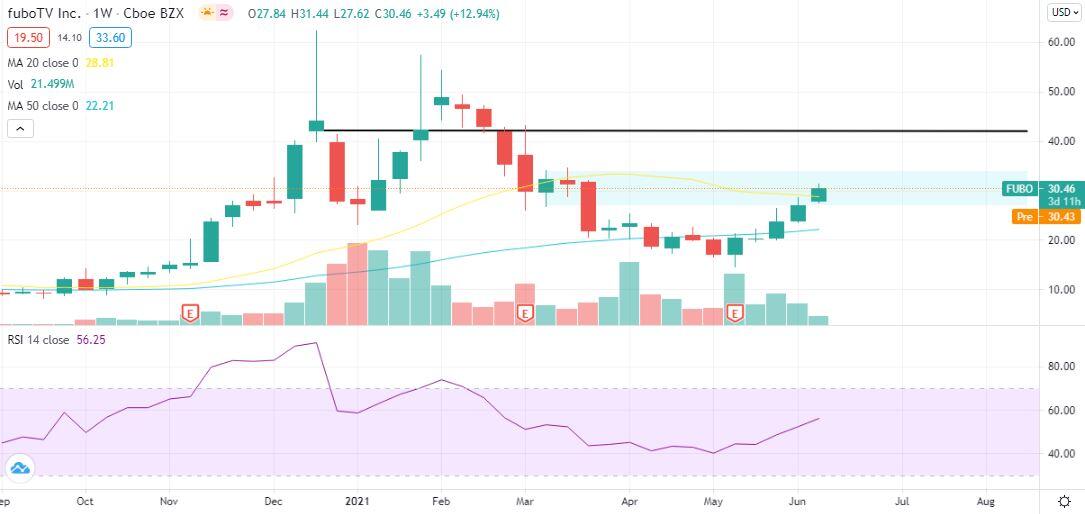
If FUBO shares close above $34.72 on the weekly chart, the next barrier is the zone directly above $42. This obstacle comes from both weekly resistance and support points during FuboTV’s remarkable rally between December 2020 and February of this year. Above $42, there is a number of varying resistance levels, since FUBO fell a full 76.5% from its December 2020 all-time high of $62.29. If the stock fails to surmount $34.72, then support can be found at $28.81, the 20-week SMA, and $22.21, the 50-week SMA.
Premium
You have reached your limit of 3 free articles for this month.
Start your subscription and get access to all our original articles.
Author

Clay Webster
FXStreet
Clay Webster grew up in the US outside Buffalo, New York and Lancaster, Pennsylvania. He began investing after college following the 2008 financial crisis.


