FuboTV Earnings Preview: Can FUBO stock overcome the Netflix effect?
- FuboTV reports earnings after the close on Thursday.
- FUBO stock is down 80% in 2022 as Netflix and Fed rate hikes hit growth stocks.
- The TV company may be set for recovery after dovish FOMC meeting.

FUBO stock made a significant gain on Wednesday as a relief rally permeated through all sectors of the stock market thanks to a dovish Fed meeting. Beaten-down growth names with obvious high-beta credentials were always likely to outperform and so it proved. By the close FUBO stock had gained over 8% to $4.57.
Read more stock market research
However, FUBO remains mired in an aggressive decoupling from pandemic momentum. The stock is down a huge 86% over the last six months.
FUBO stock news: Only needs to avoid too negative surprise
Buy-the-dip takes on new meaning with such a significant fall. Where exactly is the dip? At least, now with FUBO, you know the downside is limited to a $5 loss per share as the once-retail meme crowd favorite has slid from $62 in December 2020. So when if ever is it time to buy FUBO?
We naturally argue the risk-reward is to the upside from this earnings release. Netflix hit the sector hard and so bad news has largely been priced in. The current short-term environment is likely to see some very strong rallies from names such as FUBO that are down 70% plus over the past 6 months. But first, FUBO needs to get earnings out of the way.
Revenue is expected to show continued improvement to $242.6 million. This would represent a growth rate of over 100% year on year. Earnings per share (EPS) is due to come in at $-0.53. The problem for FUBO is not on the revenue side, though, it is on the cost basis. Revenue has ballooned from $5.8 million in September 2019 to $231 million by the end of December 2021. However, in the same time period operating income has gone from a $7 million loss to a $106 million loss. So what the hell is FUBO doing? Stock-based compensation has risen from 0 to $17 million in this period while long-term debt has ballooned.
No real surprise to see the stock trade some 80% lower in a monetary tightening environment.
While we remain negative on the stock on a long-term framework we acknowledge that current equity positioning, sentiment, and risk-reward favor more upside in the short term. All FUBO has to do is not surprise too much.
FUBO stock forecast: Bottoming out
It can't get much worse than this can it?
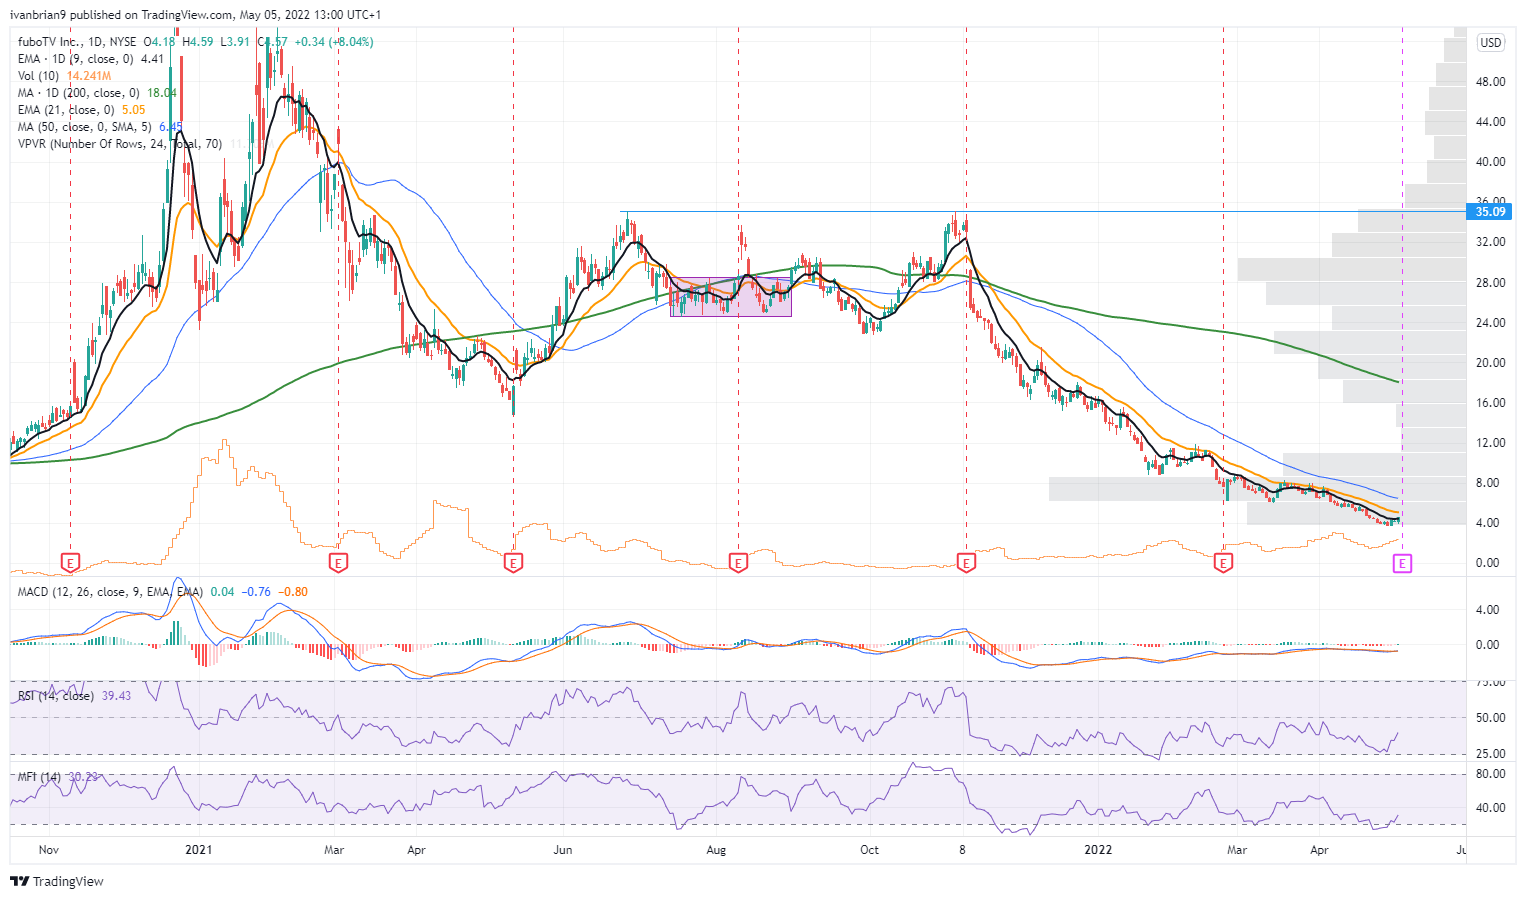
FUBO stock daily
Zooming in we have both the MFI and RSI giving us oversold flags. The current equilibrium for FUBO stock sits at $6, which still provides 25% upside from the previous close.
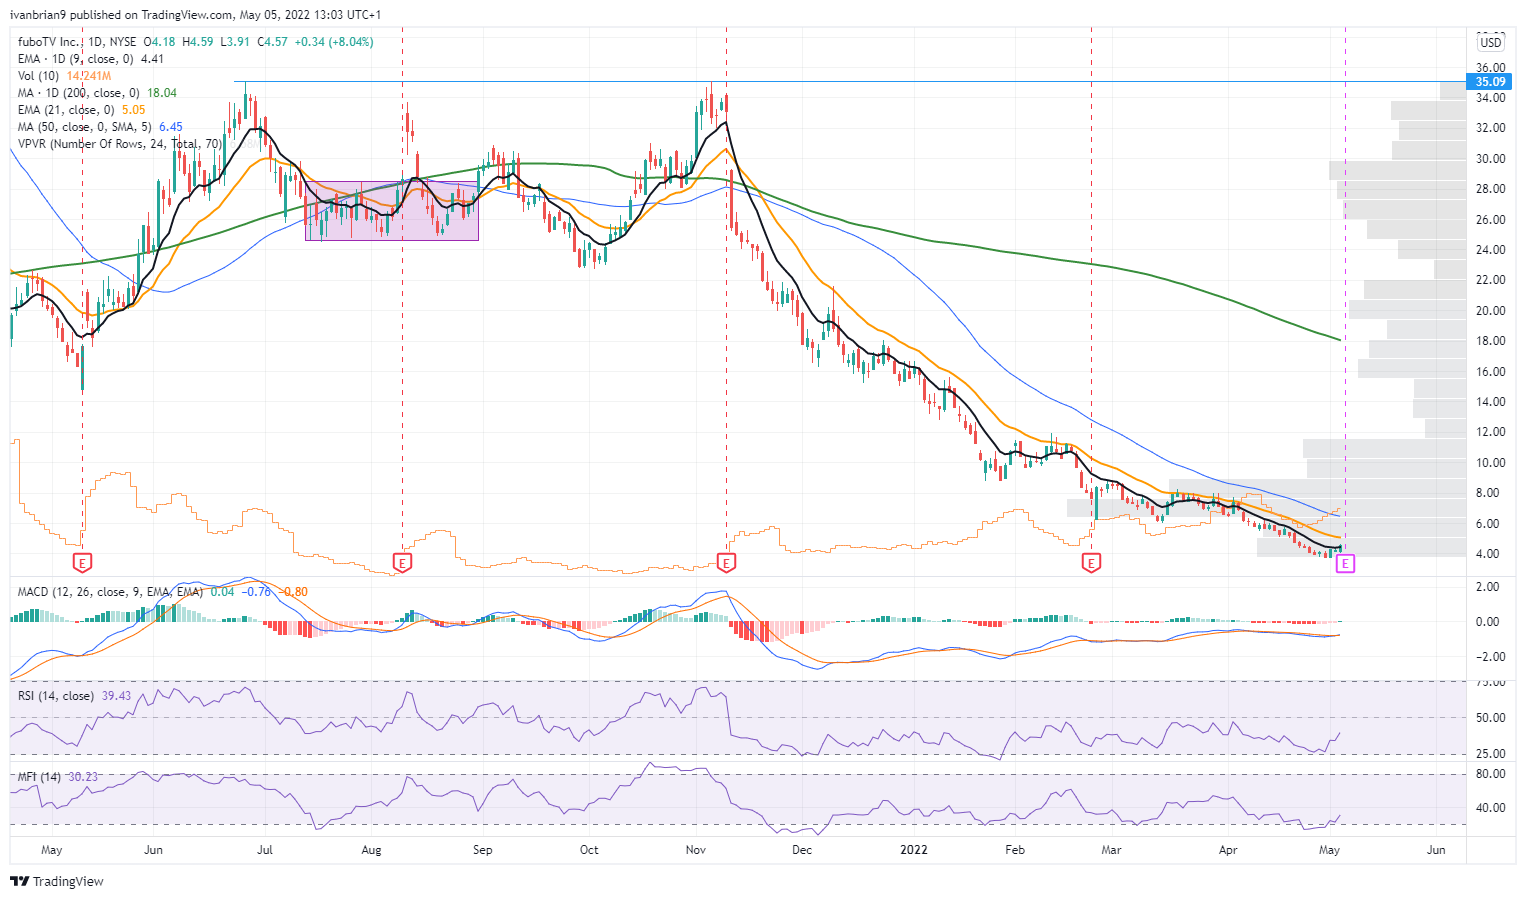
FUBO stock daily chart
* The author is long FUBO stock.
Author

Ivan Brian
FXStreet
Ivan Brian started his career with AIB Bank in corporate finance and then worked for seven years at Baxter. He started as a macro analyst before becoming Head of Research and then CFO.