Fibonacci suggests 6560 is the next upside target for the SP500

In our previous update from July 31 we anticipated for the SP500 (SPX), based on the Elliott Wave (EW) Principle, that
“… now that the $6380-6460 zone has been reached, and since price is the ultimate judge—though timing can sometimes help—the index is in a range where a pullback is more likely to start.”
The index reached a high of 6427 on the same day and dropped to as low as 6212 the next day. So far, so good. Afterwards, another rally began, reaching a high of 6481 on August 15. This week’s low at 6343 is significant because it suggests the index is completing its final 4th and 5th waves from the rally that started in April. See Figure 1 below.
Figure 1. Our preferred long-term Elliott Wave count
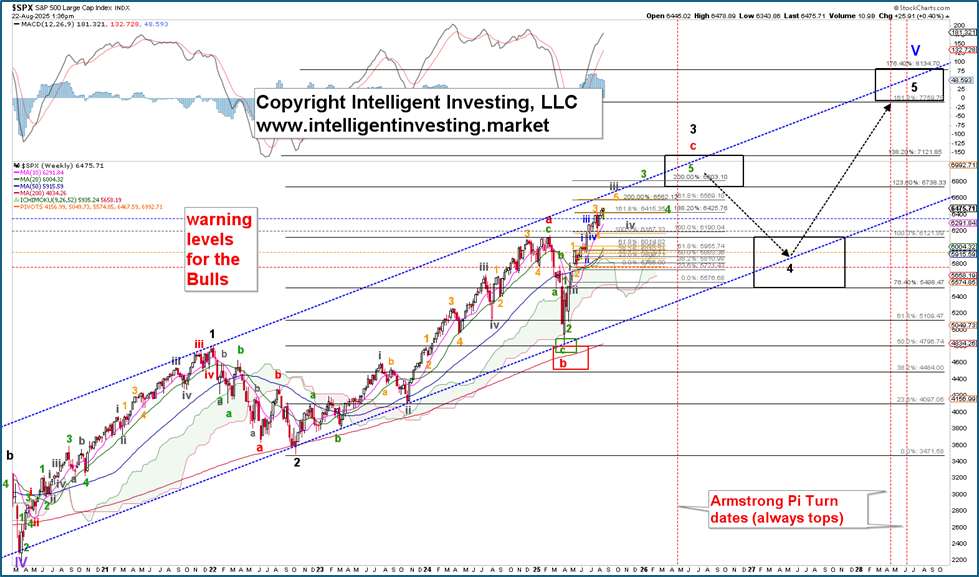
We have shared this chart before, albeit without the wave count since the April low, as we see the index in a prolonged bull run, labeled as Primary-V in blue, which began at the notorious COVID-19 low in March 2020. The blue Primary IV. Bull runs move in five waves, and there haven't been five upward waves since that low. Thus, there’s more to come.
Specifically, due to the February high at exactly the black 100% extension and the April low at the exact 50% extension, we consider the SPX to be in an ending diagonal (ED). The three larger advancing waves (1, 3, 5) within an ED can comprise three smaller waves. In this case, the black W-3 is subdividing into three smaller red waves: a-b-c.
Additionally, the target range for a third wave in an ED typically falls between the 123.6% and 138.2% extension of the black W-1 (from the March 2020 to January 2021 rally), measured from the black W-2 low (October 2022): 6738-7121. Therefore, the high on February 19 was red W-a of W-3, the low on April 8 was red W-b of W-3, and now the red W-c is well underway. C-waves most often consist of five waves, as shown in more detail in Figure 2 below.
Figure 2. The SPX weekly chart with our preferred EW count
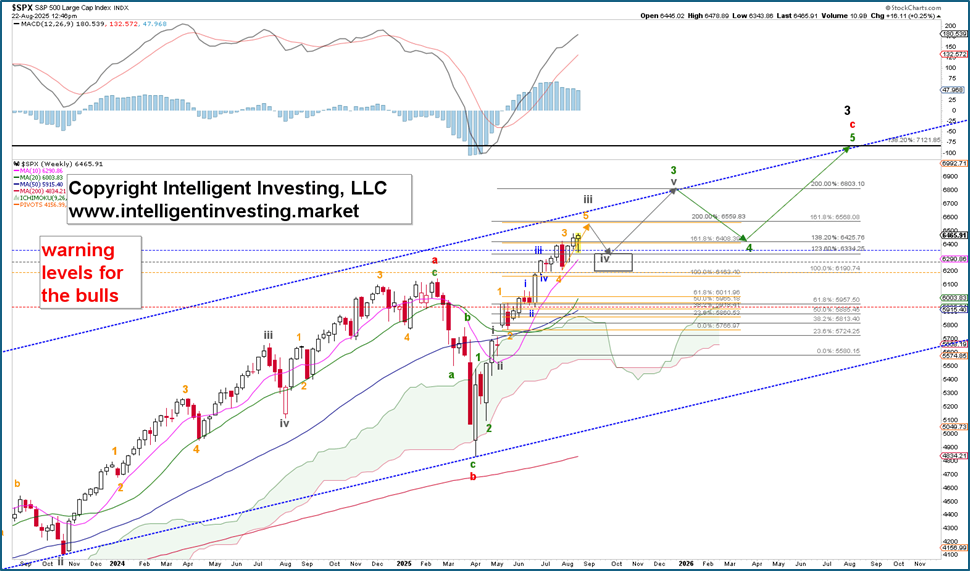
We can see that the February-April “Trump Tariffs Tantrum” crash consisted of three (green) waves: corrective. The rally since that low has advanced in an impulse pattern with the price now in the orange W-5 of the gray W-iii of the green W-3, etc. Third, fourth, and fifth waves in a typical impulse (not an ED) usually reach the 161.8, 100.0, and 200.0% extensions, respectively. In this case, the orange W-3 and W-4 did just that. Besides the 3rd of a 3rd wave, i.e., the orange W-3 of the gray W-iii, typically targets the (gray) 138.2% extension. The market also did that.
Therefore, we have good reason to believe the index is now in orange W-5, ideally reaching the 200.0% extension around 6560. Notice how this level exactly matches the gray 161.8% extension. This creates a confluence of two different wave degrees, which tend to attract price. Once the gray W-iii completes, barring any unforeseen extensions, we should see the gray W-iv decline to the 123.6-100.0% extension zone (6335-6190), followed by a W-v to its own 200.0% extension level at approximately 6800, and so on.
Based on this path, we don’t see a major top until the black W-3 completes at possibly as high as 7120, which could happen in the Spring of 2026, based on the Armstrong Pi turn date. Meanwhile, the gray iii, iv, and the green 3, 4, 5 tops and bottoms could be excellent opportunities for swing traders. As always, we will keep our premium newsletter members updated on the index’s progress daily so they don’t miss a beat.
Lastly, the warning levels for the Bulls are set at: 1st, blue: 6364; 2nd, gray: 6271; 3rd, orange: 6201; 4th, red: 5943. These levels serve as our insurance in case we’re wrong, as breaks below these levels increase the chances (25, 50, 75, 100%, respectively) that the top is in.
Author

Dr. Arnout Ter Schure
Intelligent Investing, LLC
After having worked for over ten years within the field of energy and the environment, Dr.















