FedEx (FDX Stock) completes wave 4 pullback at 38.2% Fibonacci
-
FedEx Corporation (FDX) has made a bullish bounce. But the rebound was even stronger than expected because price action broke above the top.
-
The main targets are located at the -27.2% Fibonacci level at $340 and the -61.8% Fibonacci level at $365.
-
A bullish bounce took place at the 38.2% Fibonacci level, which makes a wave 4 likely. A bullish breakout above the 21 ema high could confirm the uptrend continuation.

How far can the uptrend go? Let’s review the key Elliott Wave and Fibonacci patterns.
Price charts and technical analysis
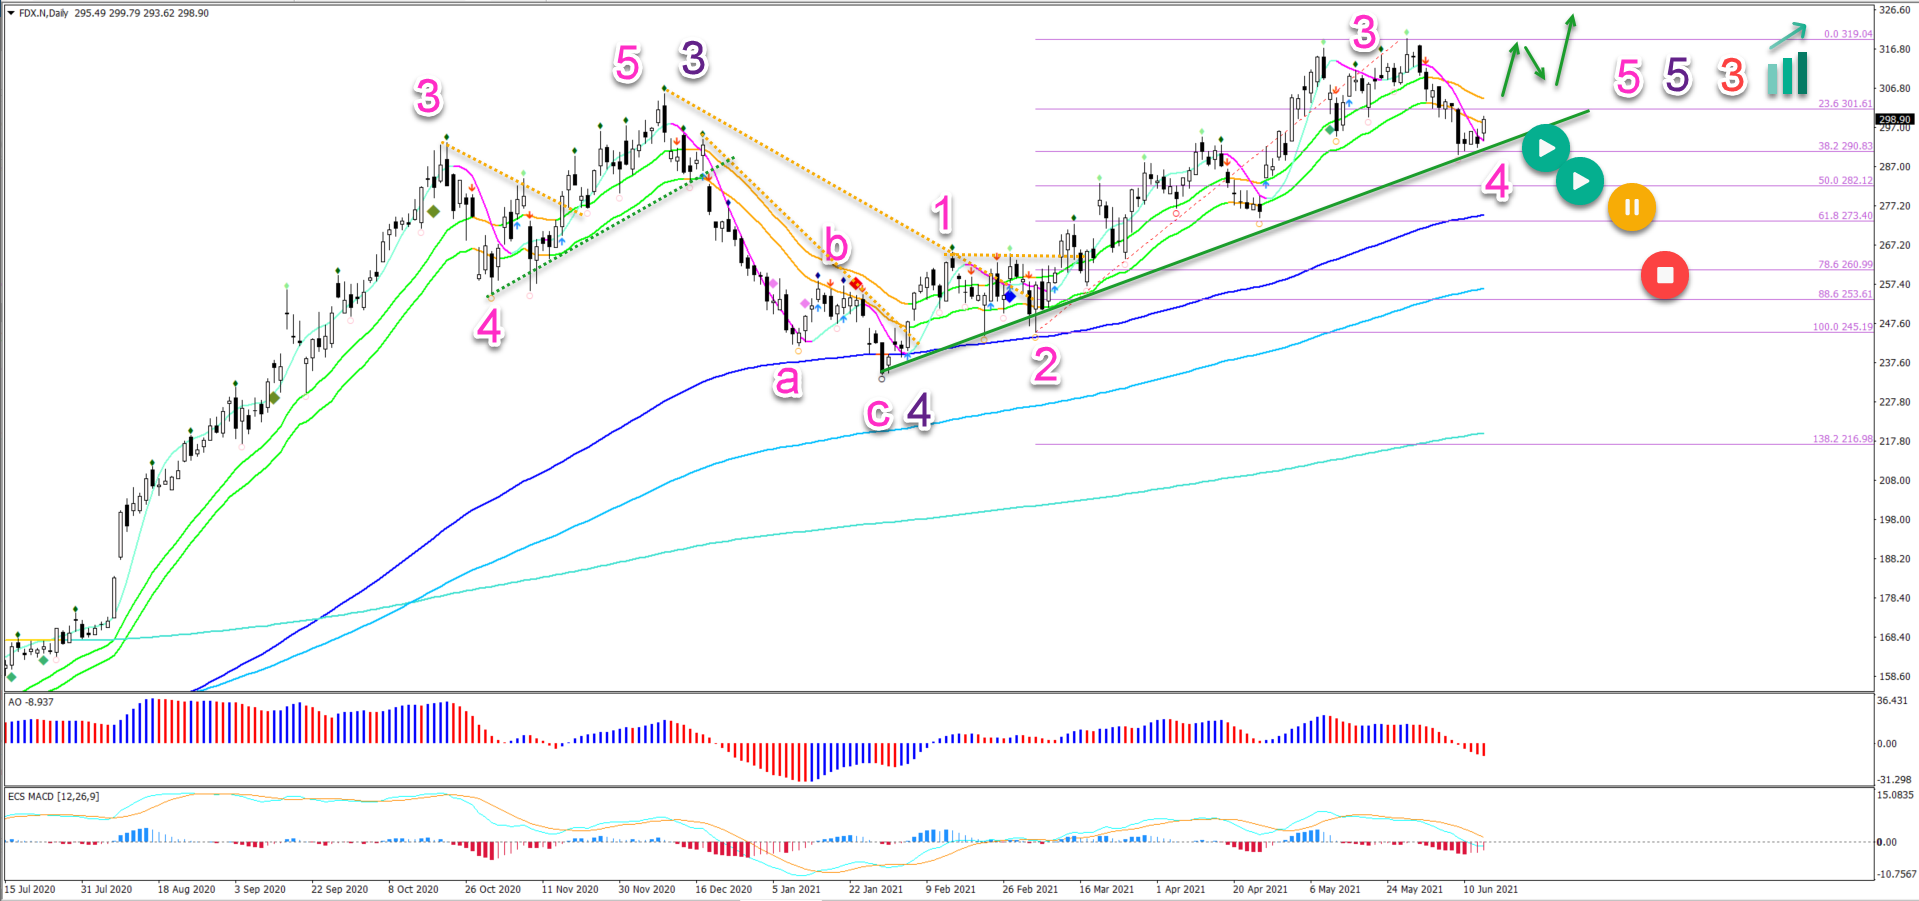
The FDX daily chart is showing a strong uptrend with all the moving averages bullishly aligned:
-
The previous price swing is a wave 3 (purple) of wave 3 (red) due to its steep angle.
-
The pullback was indeed a wave 4 (purple) which bounced at the 144 ema.
-
The current higher high is expected to be part of a wave 5 (purple) of wave 3 (red).
-
Within the wave 5 (purple), price action is building a 5 wave (pink) pattern. The current push up seems to be a wave 3 (pink).
-
The current pullback could be a wave 4 (pink) as long as price action stays above the 50% Fibonacci level.
-
A break below the 50% Fib places it on hold (orange circle) and a deeper break invalidates it (red circle).
-
The main targets are located at the -27.2% Fibonacci level at $340 and the -61.8% Fibonacci level at $365.
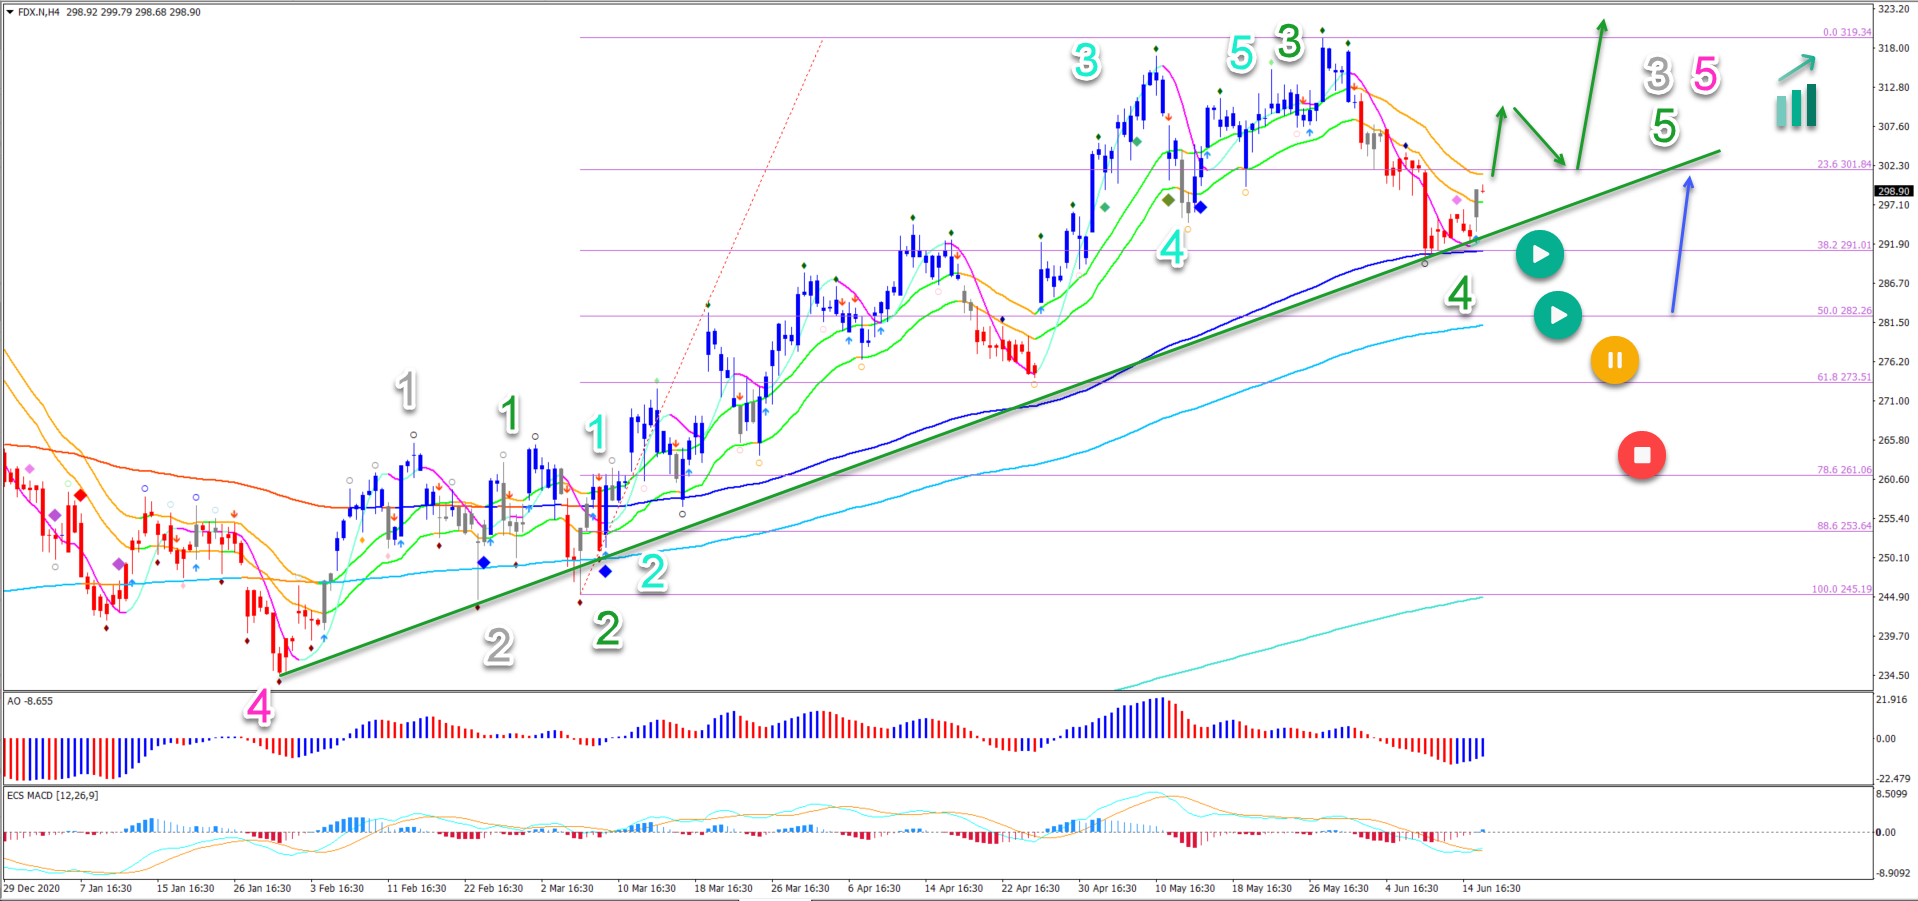
On the 4 hour chart, price action could be testing the support trend line (green):
-
A bullish bounce took place at the 38.2% Fibonacci level, which makes a wave 4 (green) likely.
-
A bullish breakout above the 21 ema high could confirm the uptrend continuation (green arrows).
-
Price action should stay above the 50% Fibonacci level if this is indeed a wave 4 (green).
-
A bullish bounce (blue arrow) could take place at the 50% Fib as well if price action gets there.
The analysis has been done with the ecs.SWAT method and ebook.
Premium
You have reached your limit of 3 free articles for this month.
Start your subscription and get access to all our original articles.
Author

Chris Svorcik
Elite CurrenSea
Experience Chris Svorcik has co-founded Elite CurrenSea in 2014 together with Nenad Kerkez, aka Tarantula FX. Chris is a technical analyst, wave analyst, trader, writer, educator, webinar speaker, and seminar speaker of the financial markets.


