|

Exxon Mobil (XOM) looking to end five waves Elliott Wave impulse [Video]

Exxon Mobil (XOM) cycle from 3.20.2023 low is in progress as a 5 waves impulse Elliott Wave structure. Up from 3.20.2023 low, wave (1) ended at 107.35 and pullback in wave 2 ended at 100.68 as the 1-hour chart below shows. Up from there, wave 1 ended at 110.17 and wave 2 ended at 109.05. Wave 3 ended at 114.64, wave 4 ended at 112.20. Final wave 5 ended at 116.85 which completed wave (3) in higher degree.

XOM 60 minute Elliott Wave chart

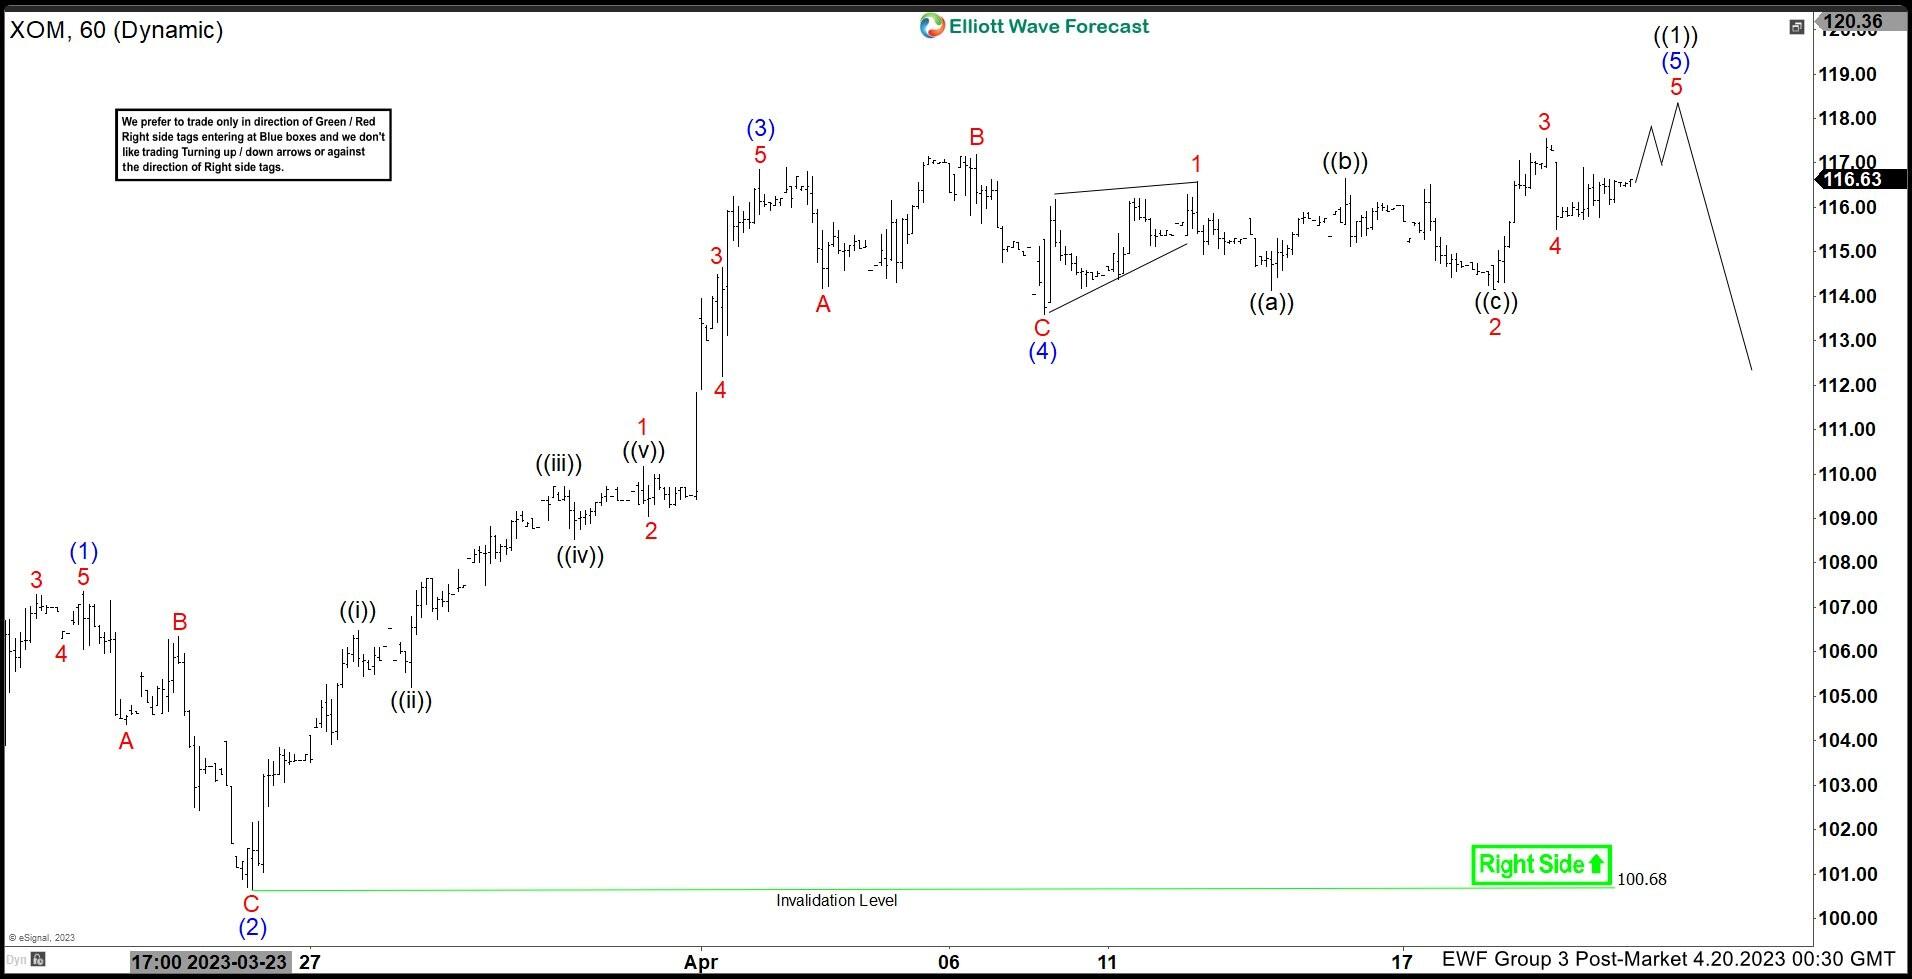
Wave (4) pullback took the form of a zigzag Elliott Wave structure. Down from wave (3), wave A ended at 114.17, and wave B ended at 117.18. Wave C lower ended at 113.6 which completed wave (4). Wave (5) is in progress as a 5 waves diagonal structure. Up from wave (4), wave 1 ended at 116.59 and pullback in wave 2 ended at 114.16. Wave 3 ended at 117.56 and dips in wave 4 ended at 115.50. Near term, expect XOM to extend higher to complete wave 5 of (5) of ((1)) before cycle from 3.20.2023 low ends and the stock see a larger degree pullback. As far as pivot at 100.68 low stays intact, expect the stock to extend the final leg higher before ending cycle from 3.20.2023 low.

XOM Elliott Wave video

Author

Elliott Wave Forecast Team

Elliott Wave Forecast Team

ElliottWave-Forecast.com

More from Elliott Wave Forecast Team
Share:

Editor's Picks

EUR/USD treads water above 1.1850 amid thin trading

EUR/USD stays defensive but holds 1.1850 amid quiet markets in the European hours on Monday.  The US Dollar is struggling for direction due to thin liquidity conditions as US markets are closed in observance of Presidents' Day. 

GBP/USD flat lines as traders await key UK and US macro data

GBP/USD kicks off a new week on a subdued note and oscillates in a narrow range near 1.365 in Monday's European trading. The mixed fundamental backdrop warrants some caution for aggressive traders as the market focus now shifts to this week's important releases from the UK and the US.

Gold sticks to intraday losses; lacks follow-through

Gold remains depressed through the early European session on Monday, though it has managed to rebound from the daily trough and currently trades around the $5,000 psychological mark. Moreover, a combination of supporting factors warrants some caution for aggressive bearish traders, and before positioning for deeper losses.

Bitcoin, Ethereum and Ripple consolidate within key ranges as selling pressure eases

Bitcoin and Ethereum prices have been trading sideways within key ranges following the massive correction. Meanwhile, XRP recovers slightly, breaking above the key resistance zone. The top three cryptocurrencies hint at a potential short-term recovery, with momentum indicators showing fading bearish signs.

Global inflation watch: Signs of cooling services inflation

Realized inflation landed close to expectations in January, as negative base effects weighed on the annual rates. Remaining sticky inflation is largely explained by services, while tariff-driven goods inflation remains limited even in the US.

Ripple Price Forecast: XRP potential bottom could be in sight

Ripple edges up above the intraday low of $1.35 at the time of writing on Friday amid mixed price actions across the crypto market. The remittance token failed to hold support at $1.40 the previous day, reflecting risk-off sentiment amid a decline in retail and institutional sentiment.