Exxon Mobil – Short-term factors vs. this line

The bulls failed in recent weeks, but have they already lost all their allies and their fate is exaggerated?
The path to lower levels
Let’s start todays analyze with the short-term perspective.

Quoting the last comment on Exxon Mobil posted on Dec. 20, 2023:
(…) Thanks to yesterday’s white candle, the price came back above the medium-term green line, invalidating the earlier breakdown, which is a bullish signal that suggests higher prices in the coming days – especially if the bulls manage to close the week above this key line.
(…) despite the above-mentioned improvement the price is still trading under the first Fibonacci retracement, which now serves as the nearest resistance. Additionally, when we take a closer look, we can also notice that stocks reached the blue dashed line – yup, the upper line of the blue triangle - the formation that brought them defeat at the turn of November and December.
On Monday, it was strong enough to stop the buyers and trigger a pullback. (…) in my opinion, as long as this nearest resistance area is not broken, I would watch the strength of the bulls closely.
Why? Because yesterday’s candlestick was formed at a lower volume than the day before, which should be a first wake-up call – especially when we factor in the nearest resistances.
From today’s point of view, we see that the idea of watching the strength of the bulls was a very good one and helped avoid a lot of the disappointment that could come with buying stocks prematurely.
Looking at the daily chart, we see that the combination of the above-mentioned resistances and apparent purchasing power encouraged the bears to come back to the trading floor. Although the bulls tried to push the price above the blue dashed line (the upper line of the blue triangle) and the 38.2% Fibonacci retracement (based on the entire mid-Oct.-mid-Dec. downward move) they failed, which resulted in a sharp and sizable decline on Dec.20.
Thanks to that drop, the sellers created pro-declining bearish engulfing pattern, which reinforced the mentioned resistance area. As you see, there was another attempt to move higher, but the bulls were disappointed once again, which resulted in one more downward move, which took the stocks to the support area based on the green gap created on Dec. 14 (98.92-99.85).
What’s next?
Taking into account the volume, which was growing day by day and the sell signal generated by the Stochastic Oscillator, it seems that the way to lower levels is open. However, in my opinion, as long as the green gap is open and the bullish engulfing pattern formed on Dec. 13 is active, lower prices are not as certain as they may seem – especially when we take into account a broader perspective.
What do I mean by writing this? Let’s take a look at the medium-term and long-term charts to find out.
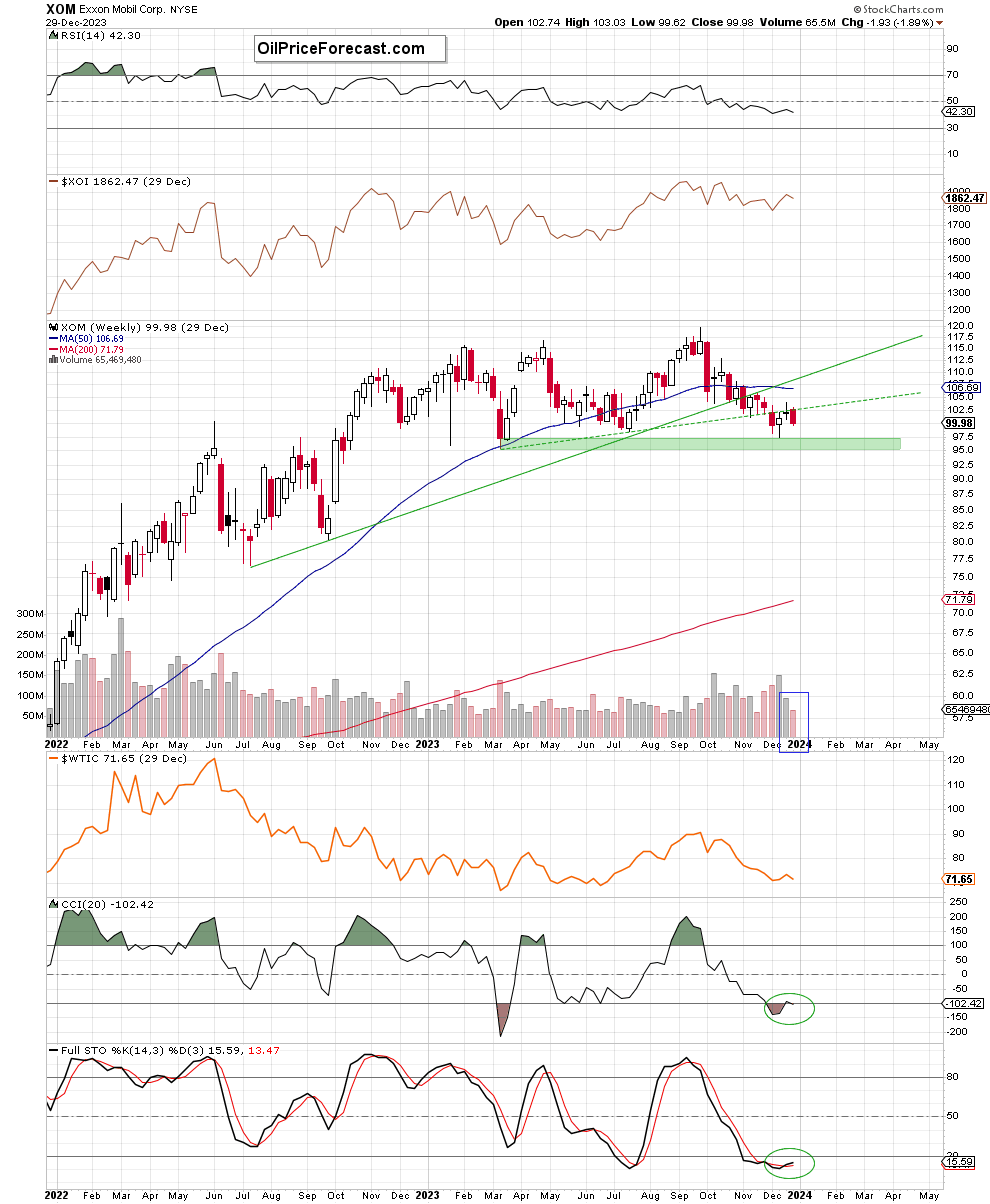
From the weekly perspective, we see that the upswing we observed before the holiday season took the stocks to the previously broken green dashed line, which serves as a resistance since the beginning of December.
Although there was a short-lived tiny breakout above this line, the bulls didn’t manage to close the week above it, which resulted in a pullback. In this way, the sellers gained another ally – a verification of the earlier breakdown under this line, which encouraged them to act in the previous week.
Thanks to the bears’ attack the price of the stocks dropped below 100 and tested the very long-term red dashed support line based on important peaks created in 2008 and 2014 (marked on the monthly chart below).
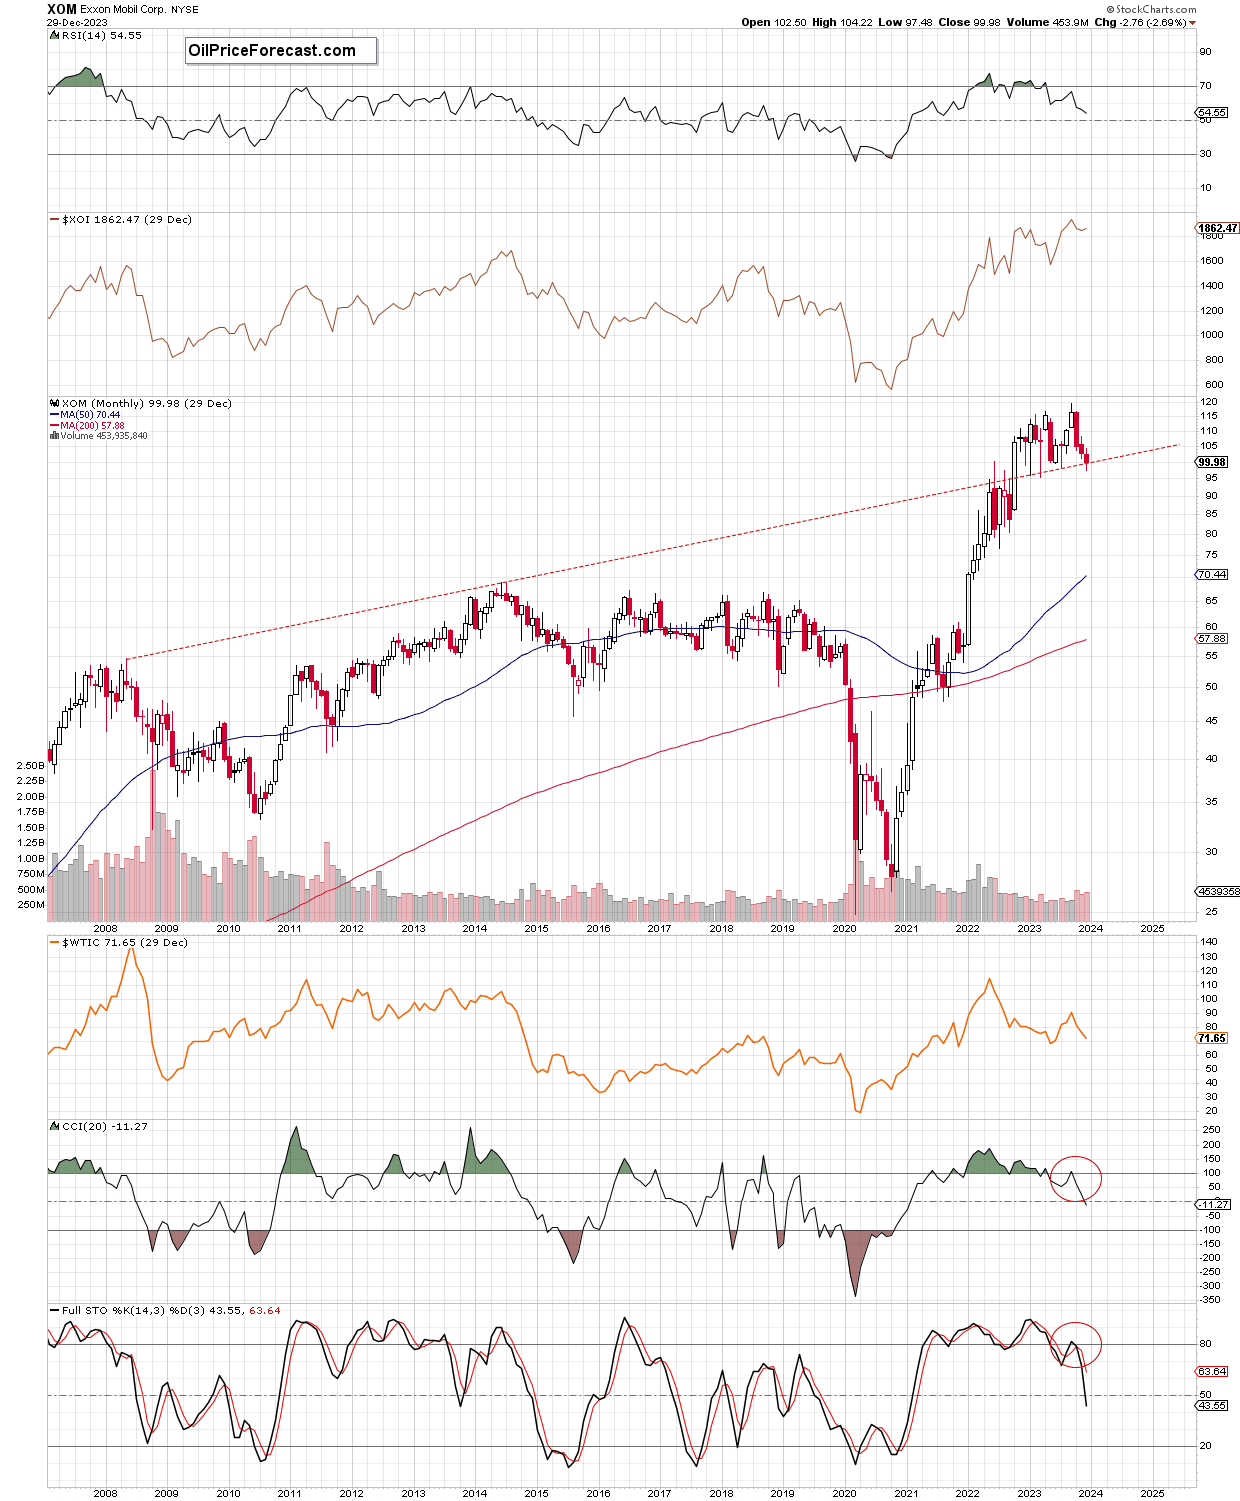
When we take a closer look at this chart, we can see that similar price action took place in January 2023, March 2023 and July 2023. In all these cases, the red support line was strong enough to stop the sellers and trigger a rebound.
What does it mean for the price?
Given the fact that history likes to repeat itself, it seems that as long as this key support line remains in the cards, another attempt to stop the bears is very likely.
This scenario is also supported not only by the short-term support area (the green gap), but also by the current position of the medium-term indicators (the CCI and the Stochastic Oscillator generated buy signals) and the volume marked on the weekly chart. As you can see, last week’s drop materialized on lower sellers’ involvement than previous increases, which suggests that the space for declines may be limited and another attempt to move higher may be just around the corner.
If this is the case and the bulls take advantage of the proximity of the main support line, showing their strength in the following days, the first upside target would be probably around 102.65, where the previously broken green dashed line (marked on the weekly chart) currently is.
Before I summarize today's stocks’ analysis let's see what might happen if, however, the buyers fail and the bears push the price down… Well, if the sellers were able to close the green gap (marked on the daily chart), then the path to the December lows and the green support zone (95.51-97.08) seen on the weekly chart would be open.
Summing up, although the bulls failed to move above first important resistances, the space for declines seems limited as the space of the green gap (marked on the daily chart) and the key support long-term line remain in the card, encouraging the bulls to fight – similarly to what we saw several times in the past year (Jan 2023, Mar 2023 and Jul 2023). If the history repeats itself once again, a reversal and higher prices may be just round the corner.
Want free follow-ups to the above article and details not available to 99%+ investors? Sign up to our free newsletter today!
Want free follow-ups to the above article and details not available to 99%+ investors? Sign up to our free newsletter today!
Author

Przemyslaw Radomski, CFA
Sunshine Profits
Przemyslaw Radomski, CFA (PR) is a precious metals investor and analyst who takes advantage of the emotionality on the markets, and invites you to do the same. His company, Sunshine Profits, publishes analytical software that any


