Expedia Group (EXPE Stock): A bullish sequence supports the buying

The Market has been in a correction since the peak at 02.14.2022. Many Market participants have turned bearish and forgot about the trend. As we always do at EWF, we locate the trend, and always relate the instrument among different time frames and cycles. The Elliott Wave Theory comes with degrees and cycles like Grand Super Cycle, and Super Cycle. Expedia stock has done a nice pull-back and we provided the target area in the past. We provided the reason in the following seminar “Are World Indices Entering into Crash Territory?”. We expected the stock to rally from the Blue Box buying area. Now, the stock is pulling back again and trading within another Blue Box area. The Elliott Wave Theory basic pattern comes with an advance in five waves and a pullback in three waves. The following chart illustrates the idea:
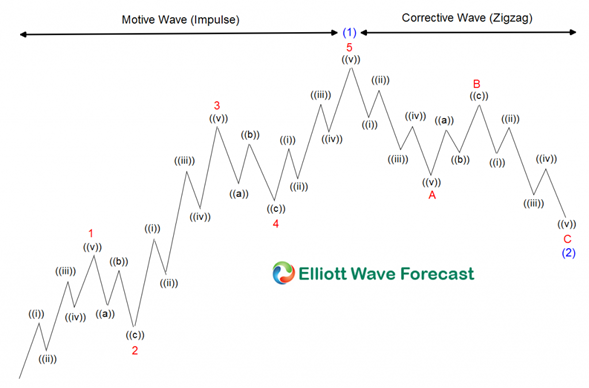
The chart above shows how each subdivision is in five waves. The degrees and sequences with the trend is in 5-9-13 swing. Also, after the cycle ended, the market corrects and traps the sellers because of the wrong impression that something bigger will happen. The correction always comes with a sequence of 3-7-11 swing. The most popular correction is a simple ABC, which structure is 5-3-5.
Expedia since the lows at ((II)) has rallied in clear five waves within the (I) degree, and now is correcting the cycle in a simple ABC. The following chart below illustrates the move
EXPE weekly Elliott Wave chart
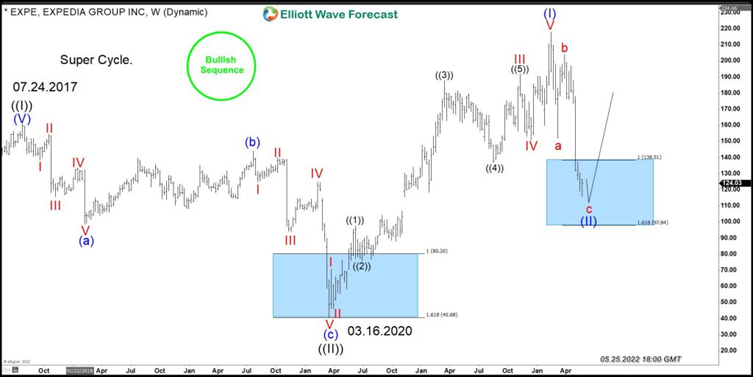
The stock shows the structure and representation of the Super Cycle degree since the lows at ((II)). We can see how since the lows the stock went from I-II-III-IV-V degree with the lesser degree ((1))((2))((3))((4))((5)). It has a perfect sequence of 5-9-13-17 which is an impulse.
The stock is now in the process of ending the abc lower against the main trend and should turn higher as far as it stays above the $97.84 area. As an alternate, if the stock trades below the $97.84 area, it will make the move from the peak in (I) as a five waves decline. Consequently, a bounce in three waves should happen before another leg lower. Even in the alternate scenario, another move higher is still going to happen as far as wave ((II)) low at 3.16.2020 holds. The Super Cycle move higher should remain in place because the stock already traded above the peak at 07.24.2017, which represents a bullish sequence in our system.
In conclusion: The stock shows a bullish sequence within the Grand Super Cycle. Buyers should remain in control against the lows at 03.16.2020. We recommend buying the dips in three, seven, and eleven, and at this moment we are within the first three waves of pullback which should offer an opportunity that can not be missed.
Author

Elliott Wave Forecast Team
ElliottWave-Forecast.com
















