Euro Stoxx 50 Elliott Wave technical analysis [Video]
Euro Stoxx 50 Elliott Wave technical analysis
Function: Bullish Trend.
Mode: Impulsive.
Structure: Gray Wave 1.
Position: Orange Wave 3.
Direction next lower degrees: Gray Wave 2.
Details: Orange Wave 2 appears completed. Now, Gray Wave 1 of Orange Wave 3 is in progress.
Wave cancel invalid level: 4495.
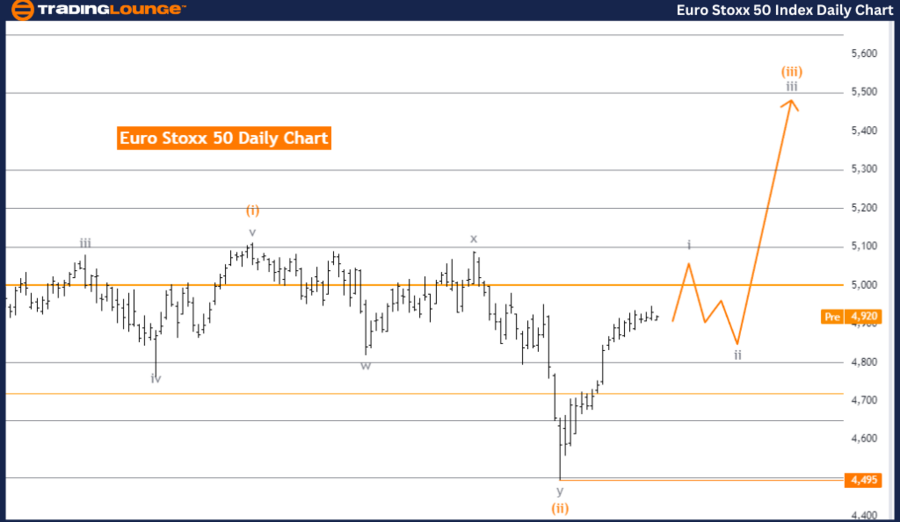
The Euro Stoxx 50 index currently shows a bullish trend according to the Elliott Wave analysis on the daily chart. The market is in an impulsive mode, indicating strong upward momentum aligned with the overall trend. The primary structure observed is Gray Wave 1, marking the start of a new wave cycle within this bullish trend.
The current market position is identified as Orange Wave 3, suggesting that the market is advancing within the third wave of the orange degree. This advancement follows the completion of Orange Wave 2, which was a corrective phase. The end of this corrective phase signals that the market has resumed its upward movement in the next impulsive wave.
Regarding the direction for the next lower degrees, Gray Wave 2 is expected to follow after the current Gray Wave 1 completes. This implies that after the ongoing upward movement in Gray Wave 1, the market may experience a brief corrective phase before continuing its bullish trend.
Details within the analysis confirm that Orange Wave 2 is now considered complete, and Gray Wave 1 of Orange Wave 3 is currently unfolding. This indicates that the market has resumed its upward trend, and this bullish movement is anticipated to continue as the new impulsive wave progresses.
In summary, the Euro Stoxx 50 index is displaying a strong bullish trend on the daily chart, with an impulsive Gray Wave 1 currently in progress. The completion of the corrective Orange Wave 2 has initiated Orange Wave 3, signaling the continuation of the upward trend. The analysis suggests that the bullish momentum will likely persist, with a potential brief correction in Gray Wave 2 following the completion of the current wave.
Euro Stoxx 50 daily chart
Euro Stoxx 50 Elliott Wave technical analysis
Function: Bullish Trend.
Mode: Impulsive.
Structure: Orange Wave 3.
Position: Navy Blue Wave 3.
Direction next higher degrees: Orange Wave 3 (continuing).
Details: Orange Wave 2 of Navy Blue Wave 3 appears completed. Now, Orange Wave 3 is in progress.
Wave cancel invalid level: 4495.
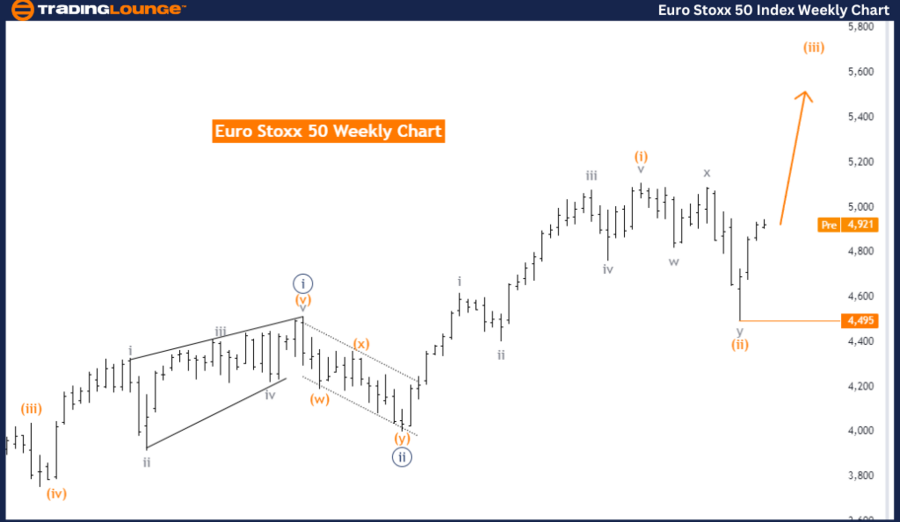
The Euro Stoxx 50 index currently demonstrates a bullish trend based on the Elliott Wave analysis on the weekly chart. The market is in an impulsive mode, indicating strong upward momentum that aligns with the ongoing bullish trend. The primary wave structure under observation is Orange Wave 3, which is a component of the larger Navy Blue Wave 3.
The current position within the wave structure is identified as Navy Blue Wave 3, suggesting that the market is advancing within this phase. This advancement follows the completion of Orange Wave 2, which was a corrective phase within the larger Navy Blue Wave 3. The completion of this corrective phase indicates that the market has resumed its upward movement in the subsequent impulsive wave.
The analysis suggests that the direction for the next higher degrees will continue to be driven by the ongoing Orange Wave 3. This implies that the bullish momentum is expected to persist as Orange Wave 3 advances, pushing the market further upward.
Key details in the analysis highlight that Orange Wave 2 of Navy Blue Wave 3 is now considered complete. As a result, Orange Wave 3 is currently unfolding, indicating that the market has resumed its upward trajectory. The bullish trend is expected to continue, with Orange Wave 3 serving as the primary driving force.
In summary, the Euro Stoxx 50 index is exhibiting a strong bullish trend on the weekly chart, with an impulsive Orange Wave 3 currently in progress. The completion of the corrective Orange Wave 2 within Navy Blue Wave 3 has led to the continuation of the bullish movement. The analysis suggests that this upward trend is likely to persist, with Orange Wave 3 driving the market higher, as long as the invalidation level of 4495 is not breached.
Euro Stoxx 50 weekly chart
Euro Stoxx 50 Elliott Wave technical analysis [Video]
Author

Peter Mathers
TradingLounge
Peter Mathers started actively trading in 1982. He began his career at Hoei and Shoin, a Japanese futures trading company.


