Euro falls back on Thursday, sees broad-market losses on ECB talking points
- Euro sheds weight as ECB cautions about risks to disinflation process.
- European inflation could take until 2025 to reach 2%.
- ECB wants wage growth to be much slower before moving on rates.

The Euro (EUR) fell against most of its major currency peers on Thursday as Euro investors rebalance their exposure. The European Central Bank (ECB) continues to caution that market expectations of rate cuts have run well ahead of what the ECB is willing to bring to the table.
Both the ECB and the Federal Reserve (Fed) have spent significant verbal effort in talking down market hopes for an accelerated pace of rate cuts. Policymakers on both sides of the Atlantic caution that movement on rate cuts will be both data-dependent and occur at a much slower pace than money markets are pricing in.
Daily digest market movers: ECB Monetary Policy Meeting Accounts reveal a firmly dovish stance
- ECB Monetary Policy Accounts reveal concerns that inflation will continue to pick back up in the near term.
- Recent fall in inflation is encouraging, but ECB policymakers remain unconvinced that progress is permanent, sees potential for ongoing inflationary risks.
- ECB expects to maintain restrictive policy stance “for some time”.
- Market repricing could derail disinflation process, according to ECB.
- A broad adjustment in rate cut expectations is underway as Fed officials continue to talk down rate cut hopes.
- Fed’s Bostic: More evidence required that inflation is on a trajectory to 2%, worst outcome would be to cut and then raise again.
- US economic data continues to outpace market forecasts. Initial Jobless Claims for the week ended January 12 slow more than expected to 187K versus forecast for 207K, down even further from previous week’s 203K.
- ECB President Christine Lagarde made her second of three appearances on Thursday while attending the World Economic Forum in Davos, Switzerland.
- Little monetary policy has been discussed by Lagarde, but one more appearance is slated for Friday at 10:00 GMT.
Euro price today
The table below shows the percentage change of Euro (EUR) against listed major currencies today. Euro was the strongest against the Swiss Franc.
| USD | EUR | GBP | CAD | AUD | JPY | NZD | CHF | |
| USD | 0.18% | -0.18% | 0.00% | -0.24% | 0.02% | 0.06% | 0.53% | |
| EUR | -0.19% | -0.36% | -0.18% | -0.43% | -0.16% | -0.10% | 0.37% | |
| GBP | 0.16% | 0.35% | 0.17% | -0.06% | 0.20% | 0.23% | 0.71% | |
| CAD | 0.00% | 0.19% | -0.18% | -0.23% | 0.00% | 0.07% | 0.54% | |
| AUD | 0.24% | 0.42% | 0.05% | 0.23% | 0.26% | 0.30% | 0.78% | |
| JPY | 0.00% | 0.19% | -0.20% | -0.01% | -0.25% | 0.06% | 0.54% | |
| NZD | -0.05% | 0.12% | -0.23% | -0.07% | -0.30% | -0.05% | 0.48% | |
| CHF | -0.53% | -0.36% | -0.72% | -0.53% | -0.79% | -0.52% | -0.48% |
The heat map shows percentage changes of major currencies against each other. The base currency is picked from the left column, while the quote currency is picked from the top row. For example, if you pick the Euro from the left column and move along the horizontal line to the Japanese Yen, the percentage change displayed in the box will represent EUR (base)/JPY (quote).
Technical Analysis: Euro backslides, EUR/USD struggles to find footing below 1.0900
The Euro (EUR) is broadly lower on Thursday, declining around a fifth of a percent against the US Dollar (USD), Canadian Dollar (CAD), and Japanese Yen (JPY). The Swiss Franc (CHF) represents the only gain for the Euro, up around a third of a percent on the day as the two European currencies compete for last place.
The EUR/USD waffled below the 1.0900 handle this week, and the pair remains unable to find its footing for a bullish recovery. Intraday action ran into the handle early Thursday before getting rejected back into near-term lows near 1.0850.
The Euro continues to get snagged on congestion against the US Dollar on the daily candlesticks. The EUR/USD is trapped in a congestion zone between the 50-day and 200-day Simple Moving Averages (SMA) at 1.0900 and 1.0850, respectively.
The pair remains up 4% from last October’s swing low into 1.0450, and the technical floor is parked near 1.0750 at December’s bottom bids.
EUR/USD Hourly Chart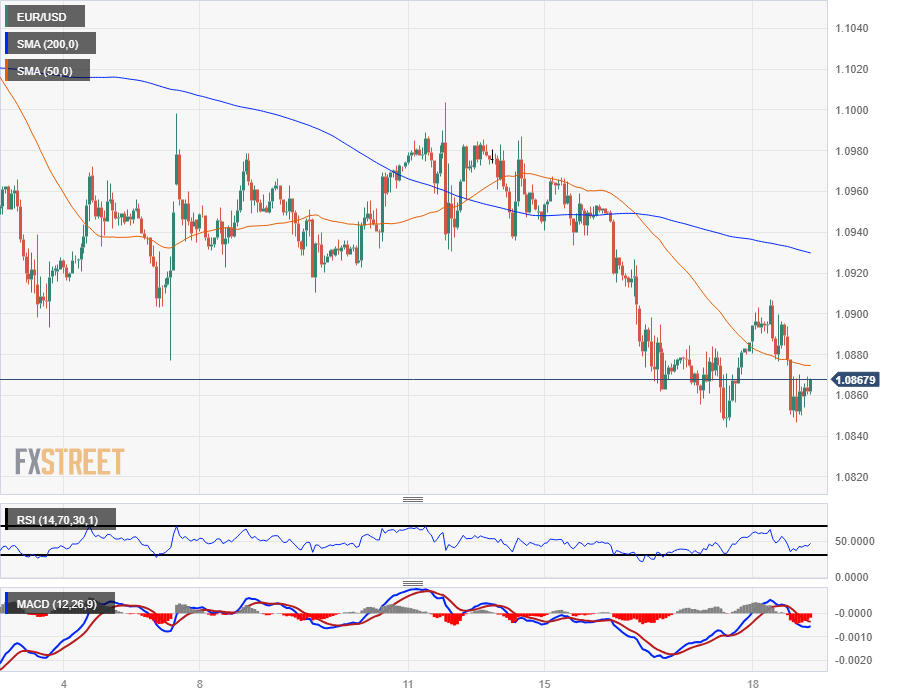
EUR/USD Daily Chart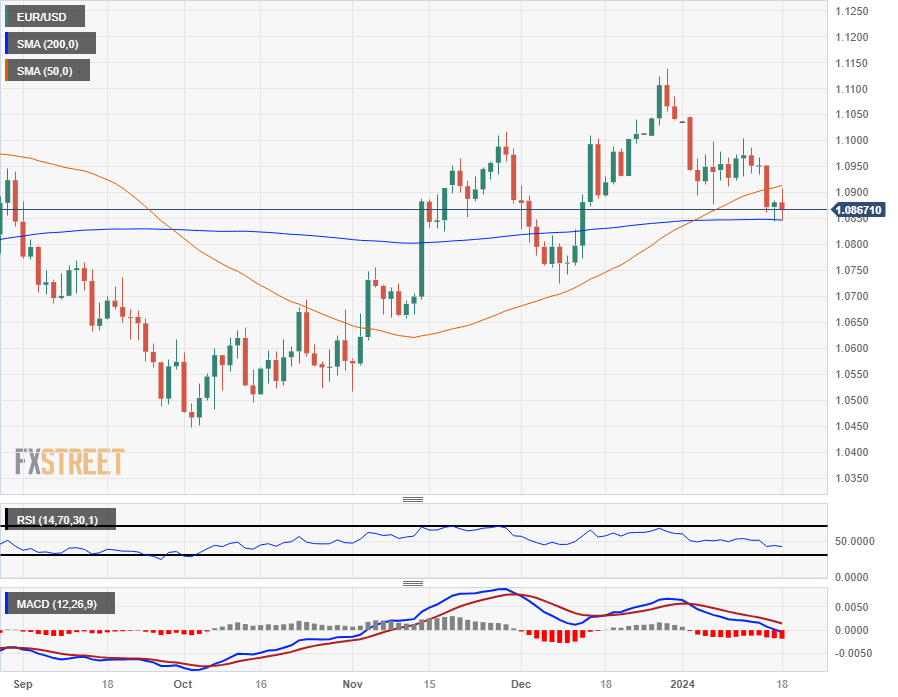
Author

Joshua Gibson
FXStreet
Joshua joins the FXStreet team as an Economics and Finance double major from Vancouver Island University with twelve years' experience as an independent trader focusing on technical analysis.