|

EUR/USD technical analysis: three-week-old trendline, September high question recent pullback

  • EUR/USD steps back from two months high amid overbought RSI.
  • Sellers will look for clarity as near-term key supports are still to conquer.

With the overbought conditions of the 14-bar Relative Strength Index (RSI) showing a lack of buying interest at the two month top, EUR/USD pulls back to 1.1160 by the press time of Asian session on Monday.

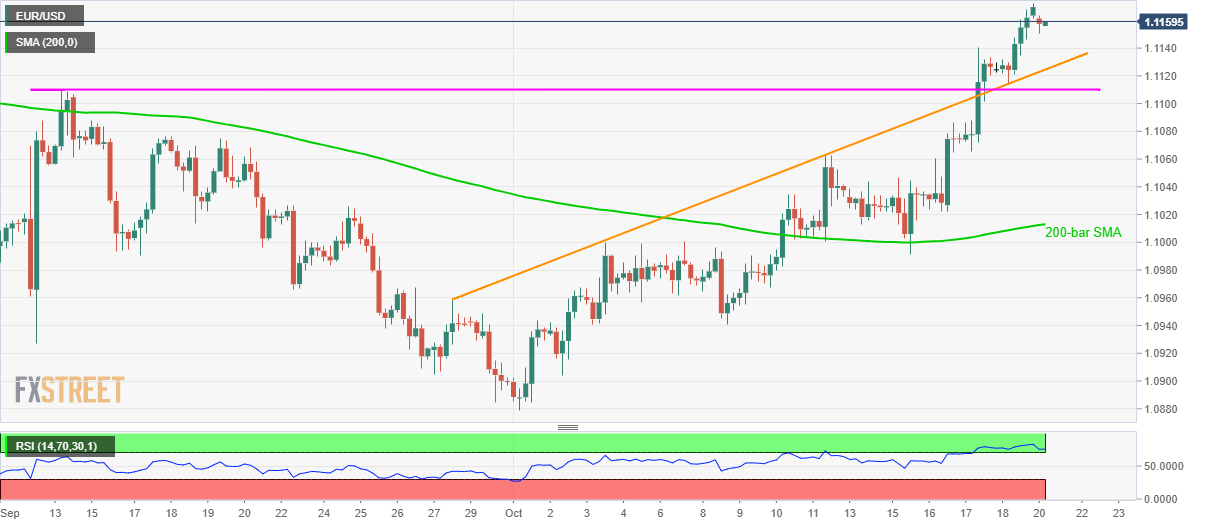
Even so, sellers are waiting for price decline below the three-week-old rising trend line, at 1.1125, followed by September high nearing 1.1110, in order to tighten their grip.

In doing so, 1.1075 and 1.1060 can entertain them ahead of highlighting the 200-bar Simple Moving Average (SMA) level of 1.1013.

Alternatively, recent high surrounding 1.1167 holds the key to pair’s run-up towards August month high surrounding 1.1250.

EUR/USD 4-hour chart

Trend: pullback expected

additional important levels

Overview
Today last price1.1158
Today Daily Change-12 pips
Today Daily Change %-0.11%
Today daily open1.117
 
Trends
Daily SMA201.0998
Daily SMA501.1039
Daily SMA1001.1139
Daily SMA2001.1211
 
Levels
Previous Daily High1.1172
Previous Daily Low1.1114
Previous Weekly High1.1063
Previous Weekly Low1.0941
Previous Monthly High1.111
Previous Monthly Low1.0885
Daily Fibonacci 38.2%1.115
Daily Fibonacci 61.8%1.1137
Daily Pivot Point S11.1132
Daily Pivot Point S21.1094
Daily Pivot Point S31.1074
Daily Pivot Point R11.119
Daily Pivot Point R21.121
Daily Pivot Point R31.1248

Author

Anil Panchal

Anil Panchal

FXStreet

Anil Panchal has nearly 15 years of experience in tracking financial markets. With a keen interest in macroeconomics, Anil aptly tracks global news/updates and stays well-informed about the global financial moves and their implications.

More from Anil Panchal
Share:

Editor's Picks

EUR/USD consolidates around 1.0900, bullish bias remains ahead of key US data

The EUR/USD pair is seen consolidating its strong gains registered over the past two days and oscillating in a narrow band during the Asian session on Tuesday. Spot prices currently trade around the 1.1900 mark, just below an over one-week high touched the previous day.

GBP/USD tilts bullish as markets barrel toward mid-week NFP print

GBP/USD is holding a broader bullish structure on the daily chart, with price trading well above the 50 Exponential Moving Average at 1.3507 and the 200 EMA at 1.3310, confirming the intermediate uptrend that has been in place since the November 2025 low near 1.2300. 

Gold: Will US Retail Sales data propel it above $5,100?

Gold hovers below weekly highs of $5,087 early Tuesday, await US Retail Sales data. The US Dollar enters a downside consolidation phase amid persistent Japanese Yen strength and worsening labor market. Gold settled Monday above $5,000, now looks to take out $5,100 amid bullish daily RSI.

Top Crypto Gainers: World Liberty Financial, MemeCore and Quant gain momentum

World Liberty Financial, MemeCore, and Quant are leading gains over the last 24 hours as the broader cryptocurrency market stabilizes after last week’s correction. Still, the technical outlook for altcoins remains mixed due to prevailing downside pressure and vulnerable market sentiment. 

Follow the money, what USD/JPY in Tokyo is really telling you

Over the past two Tokyo sessions, this has not been a rate story. Not even close. Interest rate differentials have been spectators, not drivers. What has moved USD/JPY in local hours has been flow and flow alone.

Ripple exposed to volatility amid low retail interest, modest fund inflows

Ripple (XRP) is extending its intraday decline to around $1.40 at the time of writing on Monday amid growing pressure from the retail market and risk-off sentiment that continues to keep investors on the sidelines.