|
EUR/USD Technical Analysis: The upside met strong resistance in the 1.1060 region
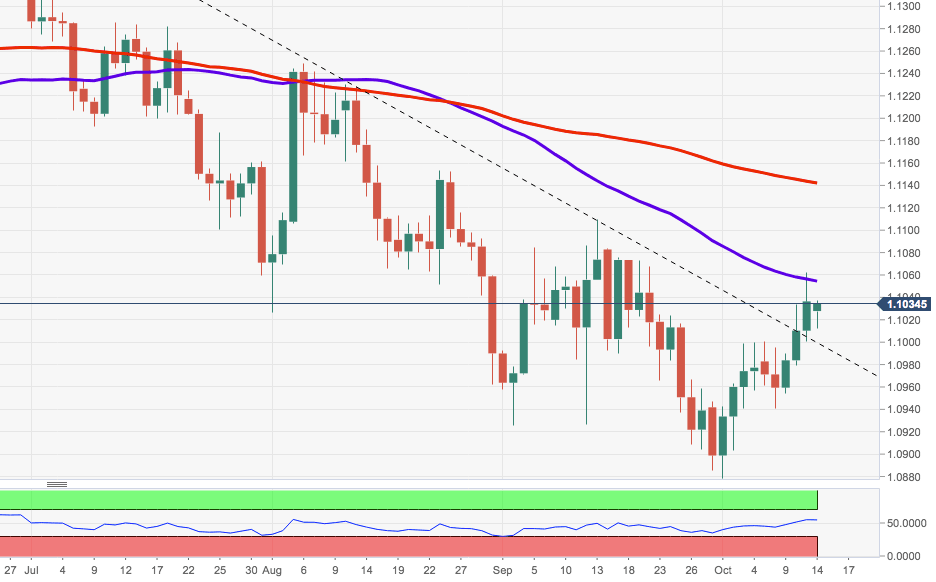
- The rally in EUR/USD briefly surpassed the key 55-day SMA in the mid-1.10s last Friday and recorded monthly tops in the 1.1060/65 band, although it did not close above it.
- If the pair manages to gather extra traction and clear the 55-day SMA, the next stop could be September’s peak at 1.1109.
- Above this area emerges the 100-day SMA at 1.1139.

EUR/USD daily chart
Author

Pablo Piovano
FXStreet
Born and bred in Argentina, Pablo has been carrying on with his passion for FX markets and trading since his first college years.
More from Pablo Piovano


