|

EUR/USD technical analysis: Fiber enters the Asian session near the 2019 lows

  • EUR/USD printed fresh 2019 lows this Thursday, reaching the 1.0908 price level.
  • The market is currently challenging the 1.0918 support. 
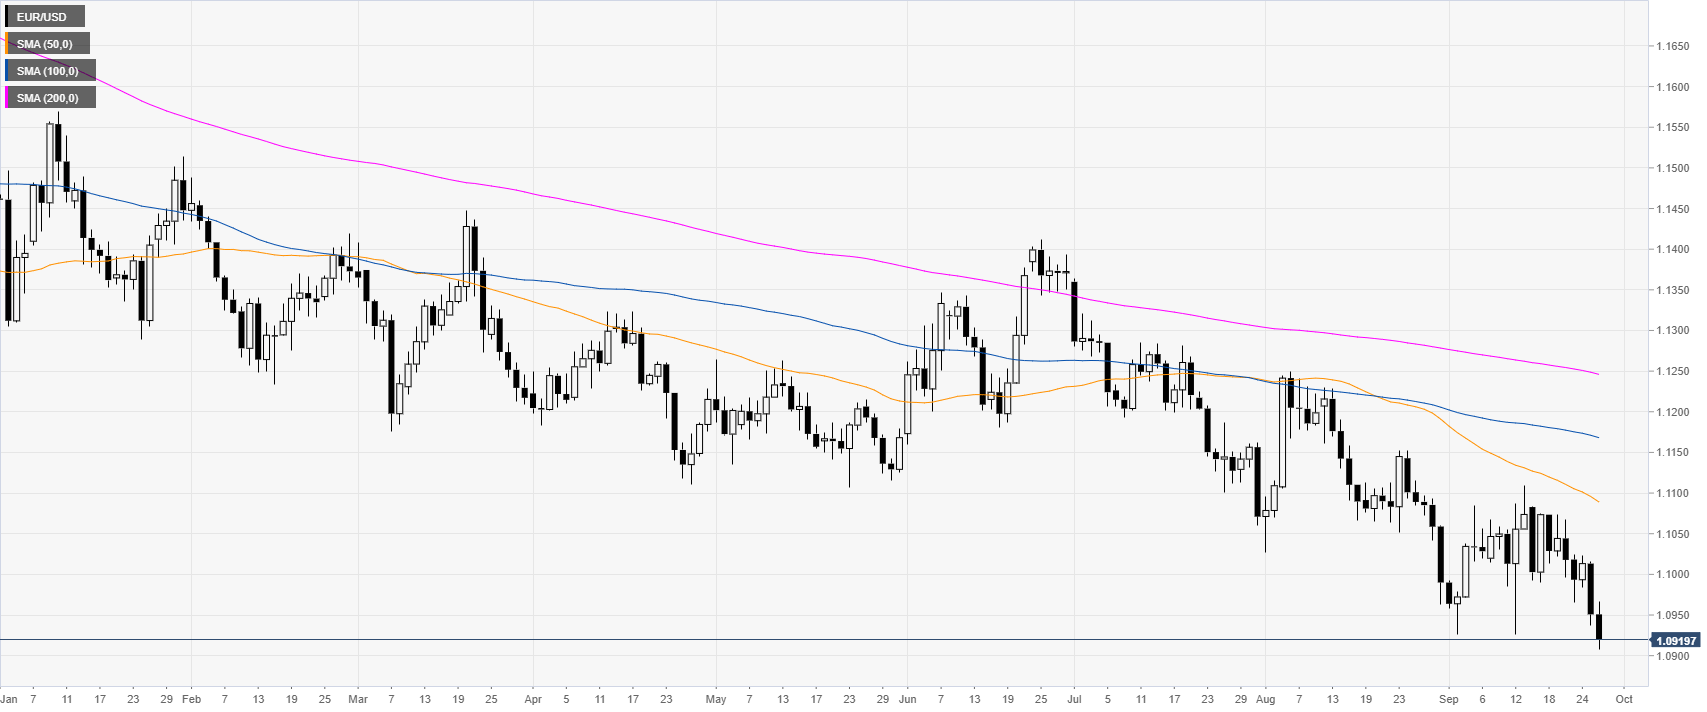
EUR/USD daily chart

The common currency, on the daily chart, is trading in a bear trend below the main daily simple moving averages (DSMAs). In the New York session on Thursday, the US Gross Domestic Product came in at 2% in line with the market expecations.

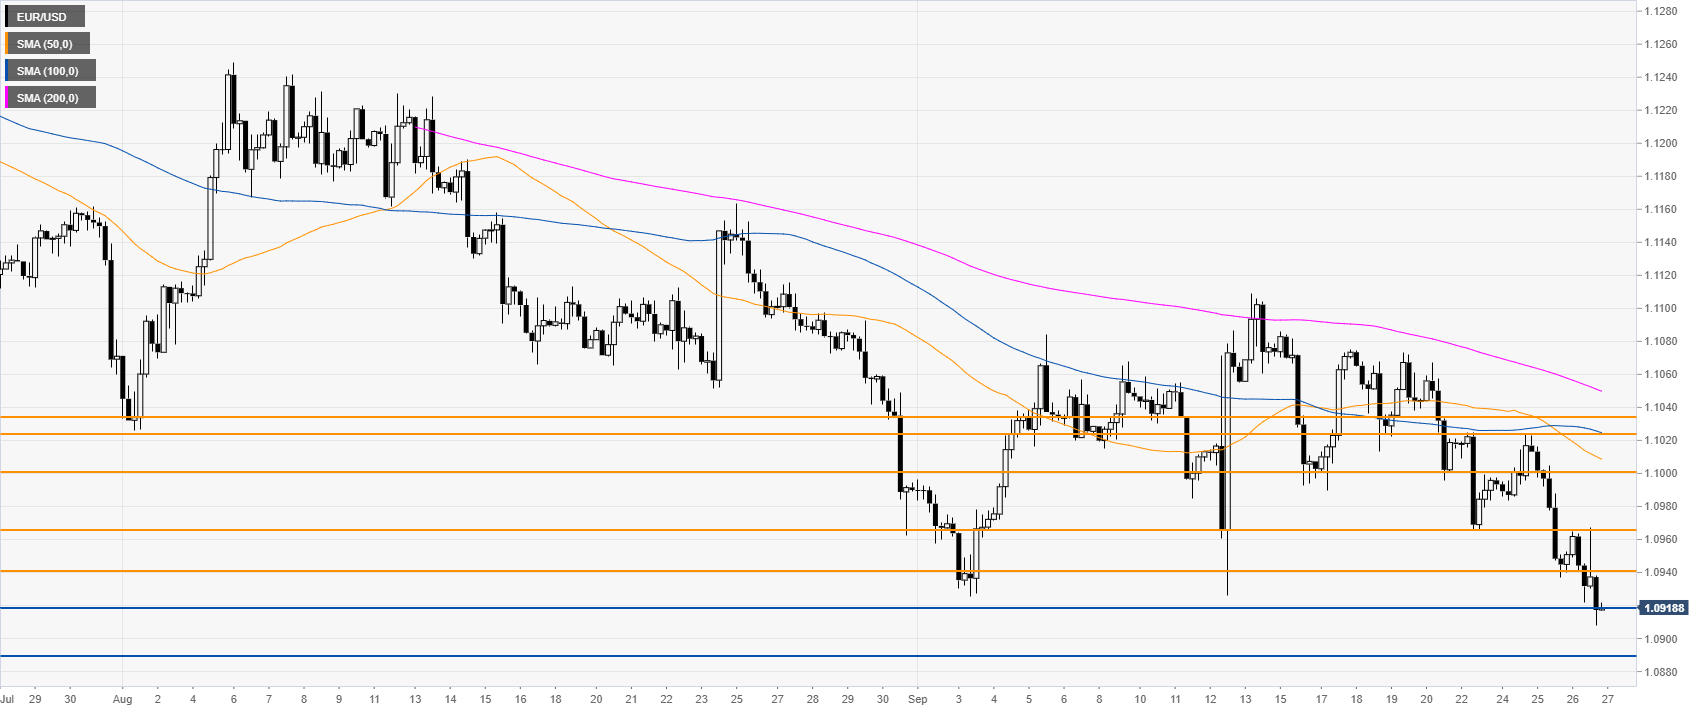
EUR/USD four-hour chart

The market is trying to break below the 1.0918 support near the 2019 low currently at 1.0908. A break below 1.0908 can open the gates to a move down to the 1.0890 price level, according to the Technical Confluences Indicator

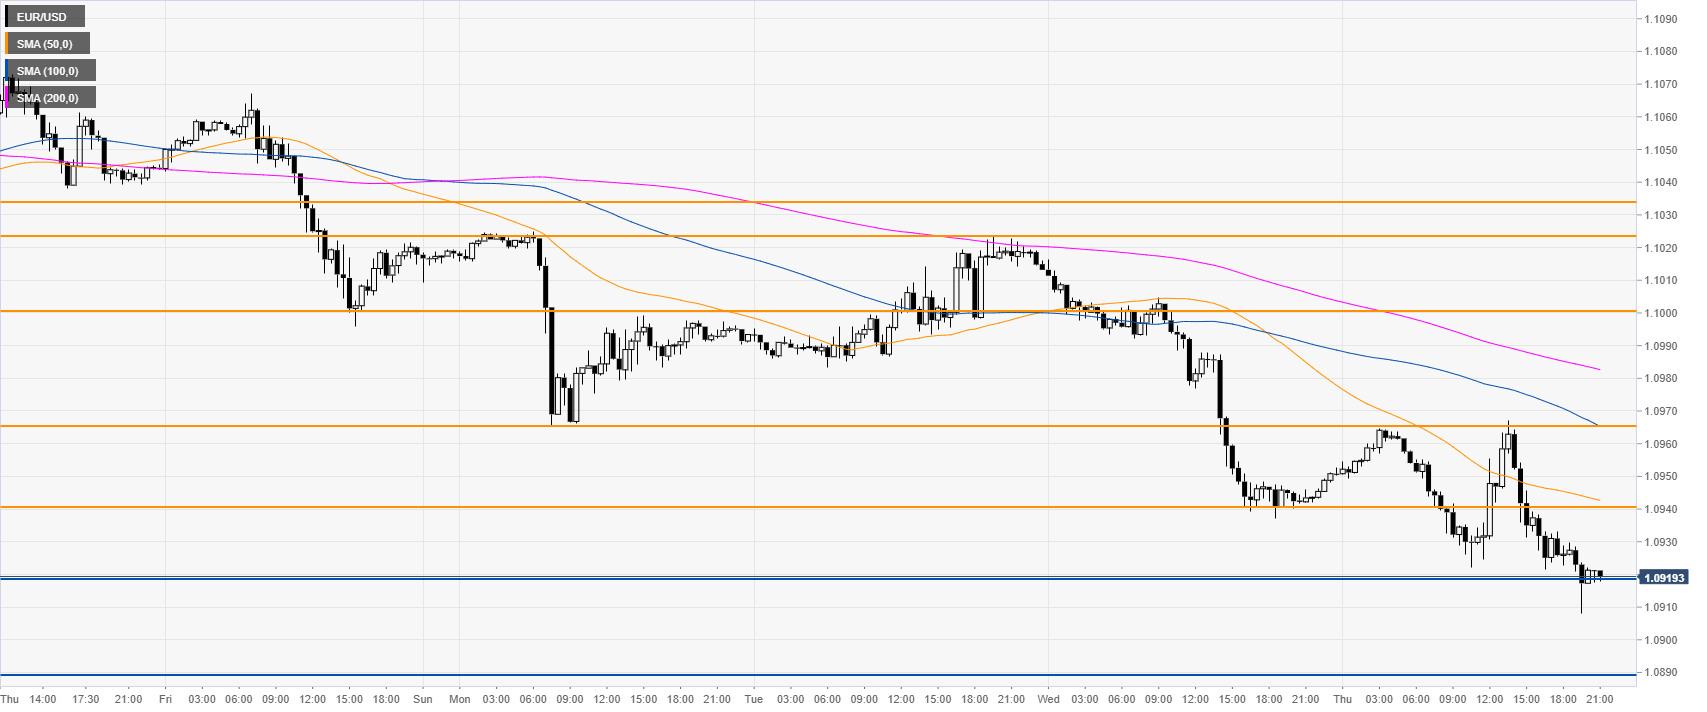
EUR/USD 30-minute chart

EUR/USD is trading below the main SMAs, suggesting a bearish bias in the near term. Immediate resistance is seen at the 1.0940 and 1.0966 levels and the 1.1000 figure, according to the Technical Confluences Indicator. 

Additional key levels

EUR/USD

Overview
Today last price1.092
Today Daily Change-0.0031
Today Daily Change %-0.28
Today daily open1.0951
 
Trends
Daily SMA201.1023
Daily SMA501.1095
Daily SMA1001.117
Daily SMA2001.1248
 
Levels
Previous Daily High1.1017
Previous Daily Low1.0938
Previous Weekly High1.1084
Previous Weekly Low1.099
Previous Monthly High1.1251
Previous Monthly Low1.0962
Daily Fibonacci 38.2%1.0968
Daily Fibonacci 61.8%1.0987
Daily Pivot Point S11.092
Daily Pivot Point S21.0889
Daily Pivot Point S31.0841
Daily Pivot Point R11.1
Daily Pivot Point R21.1048
Daily Pivot Point R31.1079

Author

Flavio Tosti

Flavio Tosti

Independent Analyst


More from Flavio Tosti
Share:

Editor's Picks

EUR/USD looks to regain the 200-day SMA

EUR/USD regains some balance and trade just above 1.1600 the figure ahead of the opening bell in Asia. The pair initially dipped to the 1.1530 zone for the first time since November, always following the stronger US Dollar and the marked flight-to-safety in the context of the ongoing Middle East crisis
 

GBP/USD slips below key averages as geopolitical risks mount

GBP/USD fell about 0.35% on Tuesday, settling around 1.3350 after slipping below the 200-day Exponential Moving Average for the first time since early December. The pair has pulled back sharply from its late-January high near 1.3870, shedding over 500 pips in a series of lower highs and lower lows. 

Gold falls to near $5,100 as inflation fears weigh amidst Middle East conflict

Gold price faces some selling pressure near $5,100 during the early Asian session on Wednesday. The precious metal falls amid a renewed US Dollar demand and dimming prospects for US rate cuts. The US ISM Services Purchasing Managers Index report will be published later on Wednesday. 

Ethereum: Whales step up buying as short positions contract

After holding firm heading into the last weekend, Ethereum whales have returned to action, pouncing on the volatility stemming from escalating military actions between the US and Iran.

Energy shock 2.0: Why rising Gas prices could hit the Euro

Even without a confirmed, sustained disruption, the mere risk to a key global energy chokepoint is enough to inject a significant premium into European Gas markets. And for the Euro, that matters.

Ripple falters amid sell-off jitters and negative funding rates

Ripple (XRP) has come under pressure, drifting lower to $1.35 at the time of writing on Tuesday. The over 2% correction looks poised to erase the previous day’s gains, which lifted the remittance token to $1.42.