|
EUR/USD technical analysis: Euro starts the week wavering above the 1.1000 handle
- EUR/USD starts the week trading mixed above the 1.1000 handle.
- Strong resistance is at 1.1067 and strong support is at 1.1000 in the New York session this Monday.

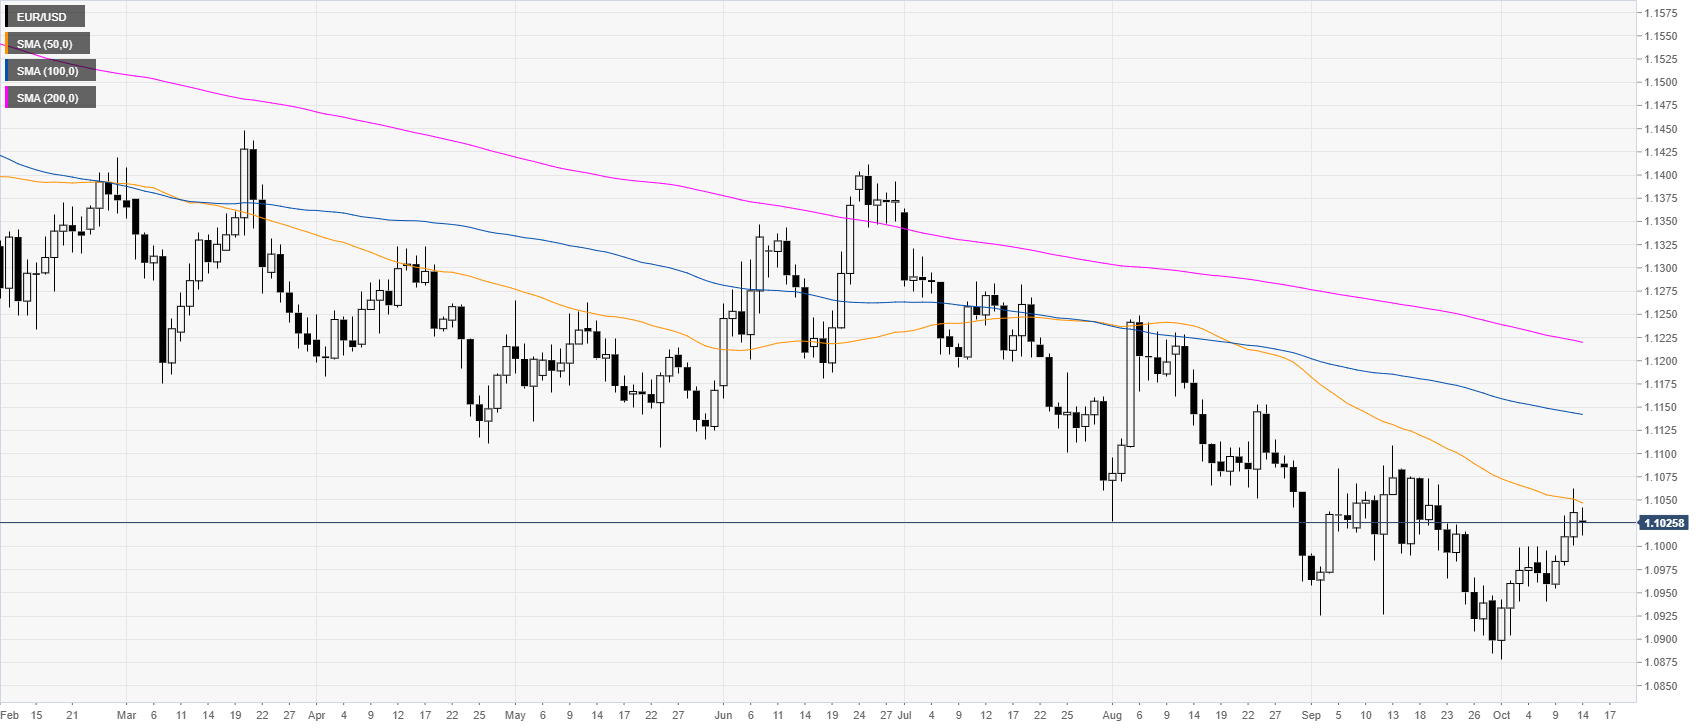
EUR/USD daily chart
On the daily chart, the common currency is trading in a bear trend below its 100 and 200-day simple moving averages (DSMAs). Last week, the Euro broke above a multi-week trendline and challenged the 50 SMA. This Monday, the market is consolidating last week’s gains below the 50 SMA.
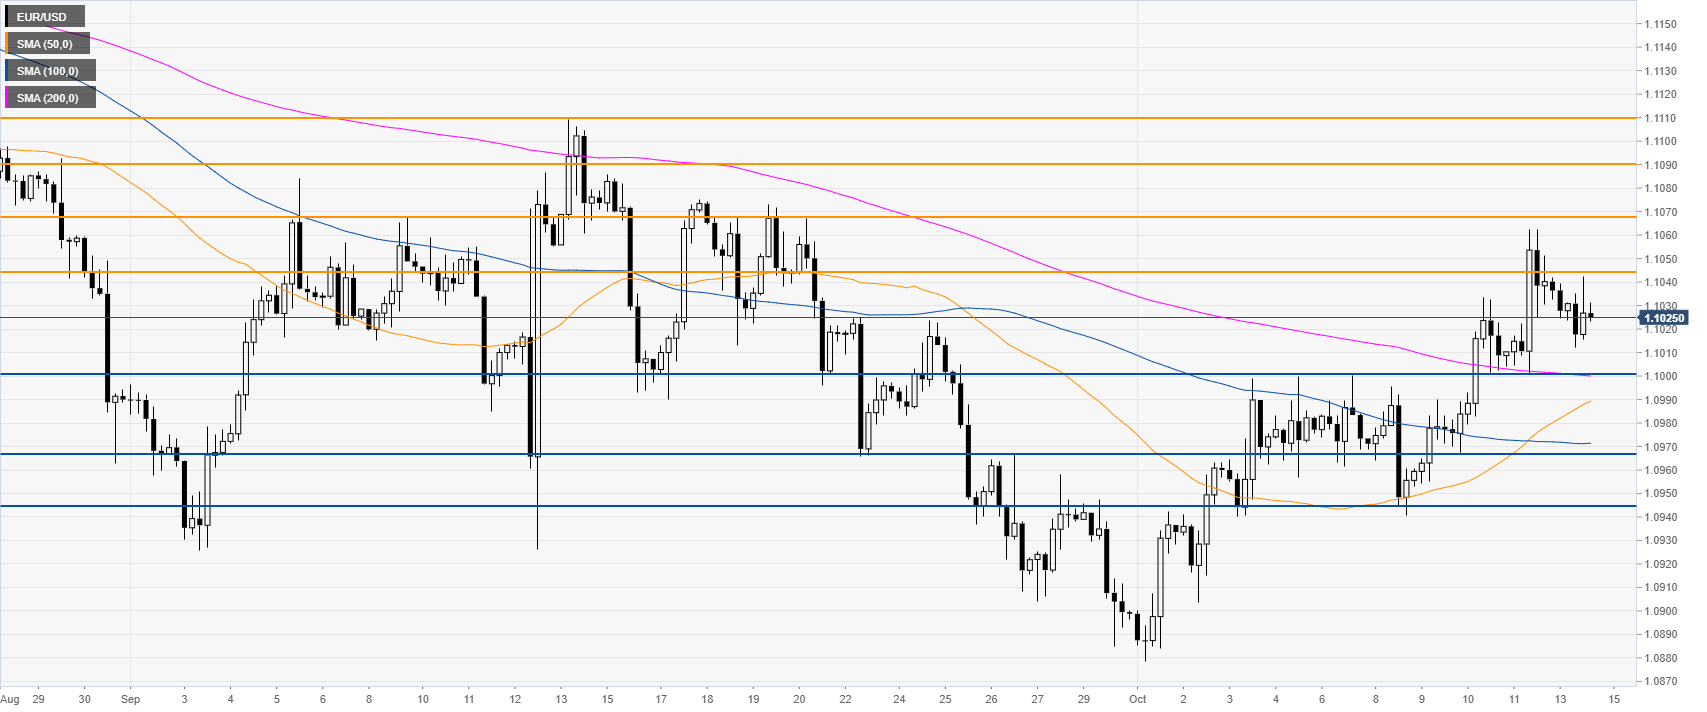
EUR/USD four-hour chart
The spot is trading above its main SMAs, suggesting bullish momentum in the medium term. EUR/USD is consolidating last week’s advance above the 1.1000 handle and the 200 SMA. The 1.1067 level become the level to beat for bulls. Further up lies 1.1090 resistance, according to the Technical Confluences Indicator.
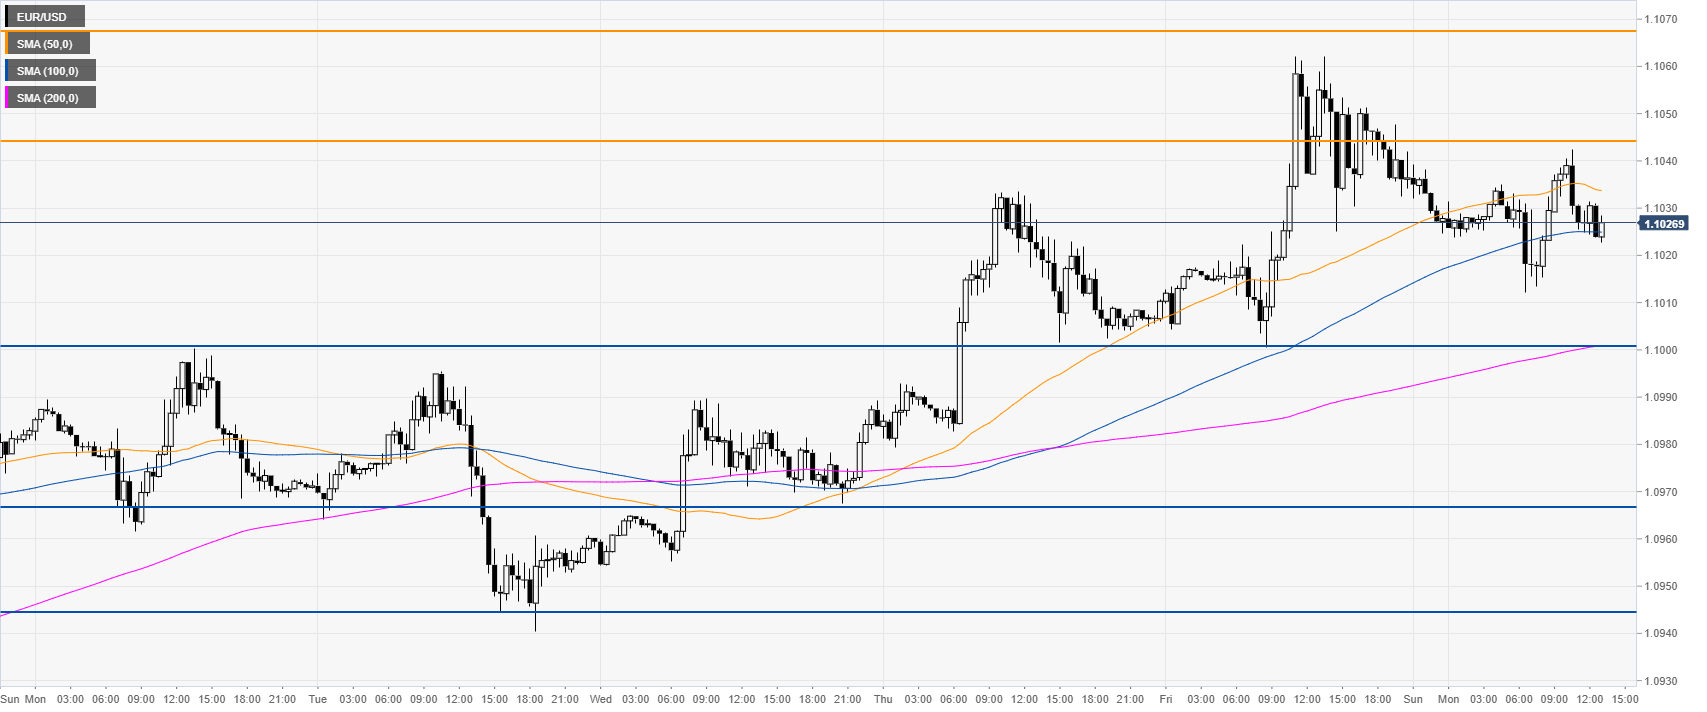
EUR/USD 30-minute chart
The Euro is trading in a small 30-pip range near the 100 SMA, suggesting a consolidation for the time being. The first level of support of relevance is at 1.1000. A daily close below this level might turn the bias to bearish in the short and medium term.
Additional key levels
Author

Flavio Tosti
Independent Analyst
More from Flavio Tosti


