|

EUR/USD technical analysis: Euro rolling into the Asian session off three-week highs near 1.1000 level

  • EUR/USD broke to three-week highs this Thursday as the European Central Bank’s (ECB) minutes showed opposition to QE (Quantitative Easing).
  • In the United States, the Core Consumer Price Index (CPI) matched analysts’ expectations at 2.4% YoY and EUR/USD eased from daily highs.
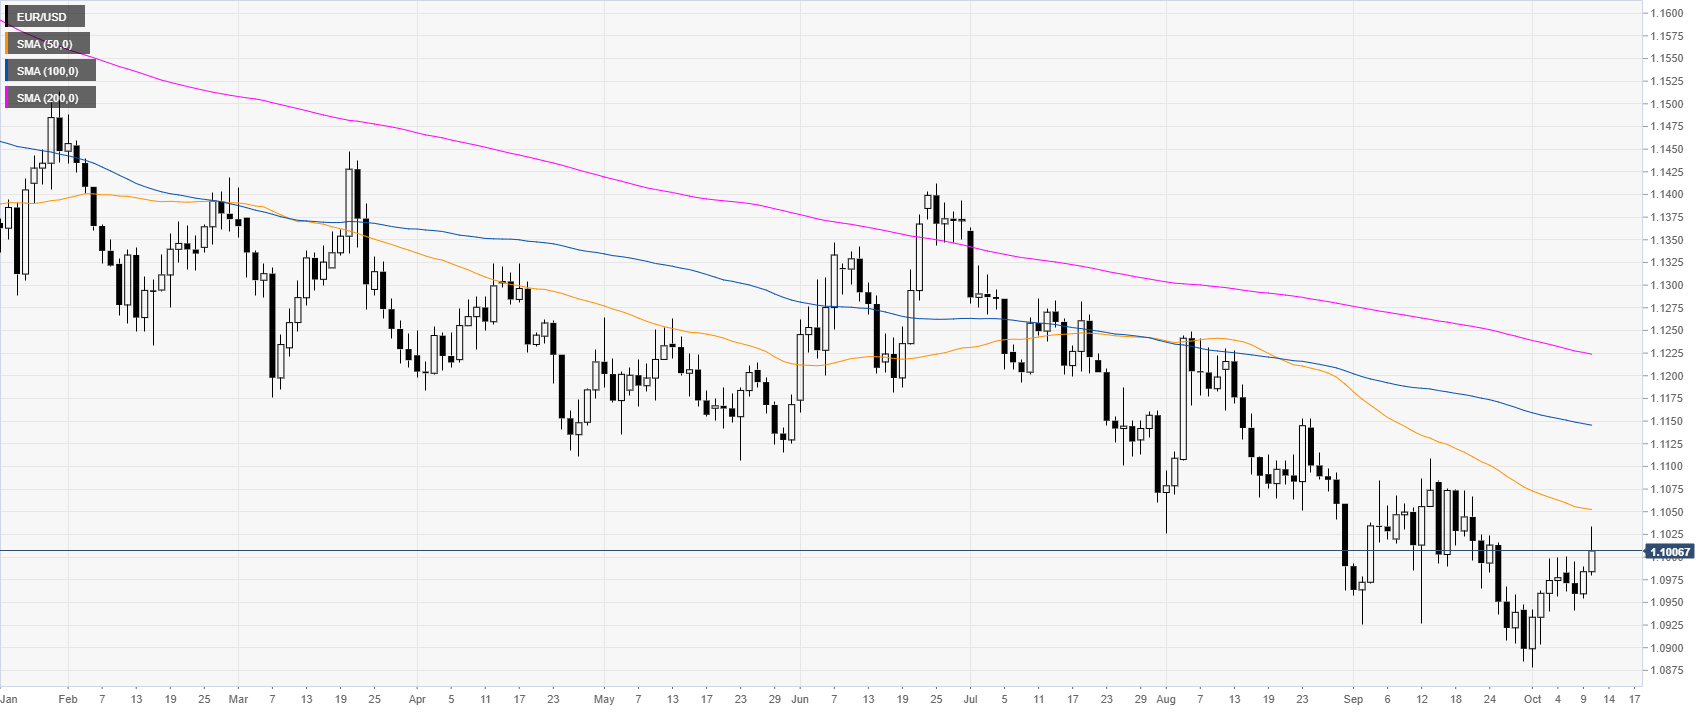


EUR/USD daily chart


On the daily chart, the shared currency is trading in a bear trend below its main daily simple moving averages (DSMAs). This Thursday in Europe, the European Central Bank’s (ECB) minutes showed opposition to QE sending EUR/USD above the 1.1000 figure. However, in the New York session, the US Core Consumer Price Index (CPI) came out at 2.4% YoY matching forecasts and EUR/USD eased about 25 pips from daily highs. 


EUR/USD four-hour chart

 
EUR/USD is consolidating the recent move up to the 1.1025 resistance. The spot is trading above its main SMAs, suggesting bullish momentum in the medium term. If the market holds above the 1.1000/1.1025 support zone, EUR/USD can attempt to run towards the 1.1080 level on the way up, according to the Technical Confluences Indicator
 

EUR/USD 30-minute chart


The Fiber is trading above its main SMAs, suggesting bullish momentum in the near term. Support can be seen at the 1.1000 and 1.0976 support level. A daily close below those levels could mitigate the short term bullish bias.
 

Additional key levels 

EUR/USD

Overview
Today last price1.1007
Today Daily Change0.0023
Today Daily Change %0.21
Today daily open1.0984
 
Trends
Daily SMA201.0989
Daily SMA501.1053
Daily SMA1001.1146
Daily SMA2001.1225
 
Levels
Previous Daily High1.099
Previous Daily Low1.0955
Previous Weekly High1.1
Previous Weekly Low1.0879
Previous Monthly High1.111
Previous Monthly Low1.0885
Daily Fibonacci 38.2%1.0977
Daily Fibonacci 61.8%1.0968
Daily Pivot Point S11.0963
Daily Pivot Point S21.0941
Daily Pivot Point S31.0927
Daily Pivot Point R11.0998
Daily Pivot Point R21.1012
Daily Pivot Point R31.1033

Author

Flavio Tosti

Flavio Tosti

Independent Analyst


More from Flavio Tosti
Share:

Editor's Picks

EUR/USD flirts with weekly lows near 1.1770

EUR/USD now comes under further selling pressure, breaking below the 1.1800 support to challenge the area of weekly throughs near 1.1770 on Thursday. The pair’s decline comes in response to marked gains in the US Dollar amid steady geopolitical tensions. Ealier in the day, the ECB’s Lagarde delivered cautious remarks, although the currency remained apathetic.

GBP/USD threatens the 200-day SMA near 1.3440

GBP/USD rapidly leaves behind Wednesday’s strong advance, coming under heavy pressure and retesting the 1.3440 zone, where the critical 200-day SMA is located. Cable’s deep pullback follows the strong gains in the Greenback, while investors continue to pencil in a potential BoE rate cut in March.

Gold trims gains, slips back to around $5,170

Gold is now facing some downside pressure, hovering around the $5,170 region on Thursday. The yellow metal surrenders part of its earlier gains on the back of the resurgence of the buying interest in the Greenback. In the meantime, geopolitical tensions in the Middle East continue to limit the downside potential for now.

Stellar: Relief bounce fades as bearish undertone persists

Stellar is trading around $0.16 at the time of writing on Thursday after rebounding more than 8% in the previous day. Derivatives data paints a negative picture as XLM’s short bets hit a monthly high while Open Interest continues to decline.

Changing the game: International implications of recent tariff developments

The Supreme Court ruling on International Emergency Economic Powers Act (IEEPA) tariffs provides limited relief for the rest of the world, with weighted average tariff rates modestly lower.

Bitcoin steadies as traders eye US–Iran talks

Bitcoin (BTC) price is stabilizing around $68,000 at the time of writing on Thursday after a 6.2% relief rally the previous day amid a broader downward trend.