|

EUR/USD technical analysis: Euro prints fresh weekly lows near 1.1220

  • The level to beat for bears is 1.1200.
  • EUR/USD is testing the 50 DSMA near 1.1220.
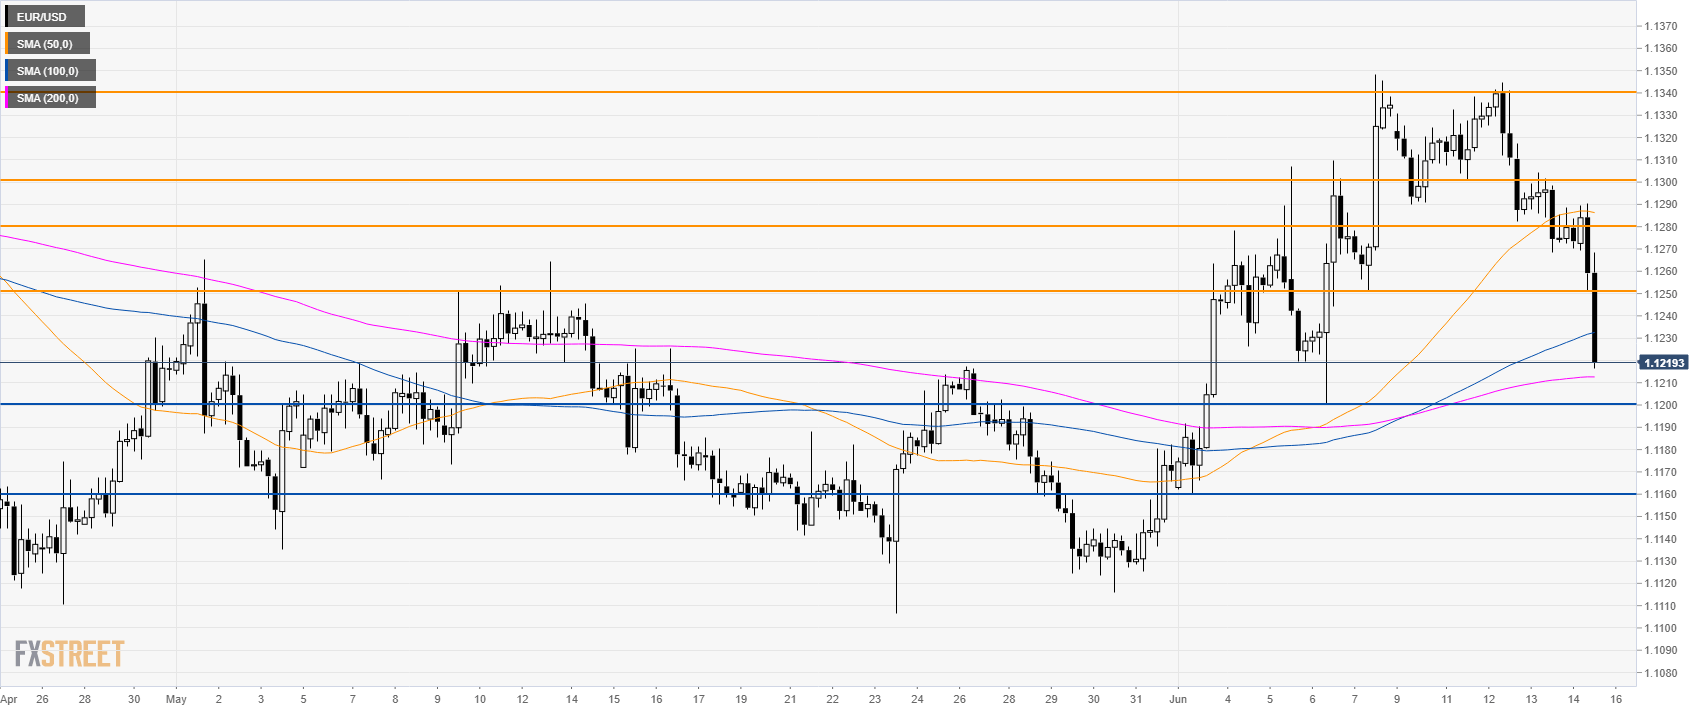
EUR/USD daily chart

EUR/USD is trading in a bear trend below its 100 and 200-day simple moving average (DSMA). The market is testing the 50 DSMA at 1.1220.


EUR/USD 4-hour chart
 

The market broke below 1.1250 and is currently approaching the 1.1200 handle. After it comes the 1.1160 support if the bears gather enough steam. Resistance is at 1.1250 and 1.1280. 

Additional key levels

EUR/USD

Overview
Today last price1.122
Today Daily Change-0.0056
Today Daily Change %-0.50
Today daily open1.1276
 
Trends
Daily SMA201.1217
Daily SMA501.122
Daily SMA1001.1273
Daily SMA2001.1363
Levels
Previous Daily High1.1304
Previous Daily Low1.1268
Previous Weekly High1.1348
Previous Weekly Low1.116
Previous Monthly High1.1266
Previous Monthly Low1.1107
Daily Fibonacci 38.2%1.1282
Daily Fibonacci 61.8%1.1291
Daily Pivot Point S11.1261
Daily Pivot Point S21.1247
Daily Pivot Point S31.1225
Daily Pivot Point R11.1297
Daily Pivot Point R21.1319
Daily Pivot Point R31.1333

Author

Flavio Tosti

Flavio Tosti

Independent Analyst


More from Flavio Tosti
Share:

Editor's Picks

EUR/USD holds above 1.1750 after mixed EU PMI data

EUR/USD manages to hold above 1.1750 but struggles to gather recovery momentum on Friday, following the mixed February PMI figures from Germany and the Eurozone. In the second half of the day, Q4 GDP, December inflation and February PMI data from the US will be watched closely by market participants.

GBP/USD recovers further toward 1.3500 after UK PMI data

GBP/USD is recovering ground further toward 1.3500 in European trading on Friday, helped by a modest uptick in the Pound Sterling after stronger-than-expected UK January Retail Sales and February PMI data. However, the pair's further upside could be limited amid persistent US Dollar strength as the focus turns to key US data. 

Gold sticks to positive bias above $5,000 ahead of US data

Gold gains some positive traction for the third consecutive day on Friday. holding above $5,000. Traders now look forward to the key US macro releases – the Advance Q4 GDP report and the Personal Consumption Expenditures (PCE) Price Index – for fresh trading impetus. 

US GDP growth expected to slow down significantly in Q4 after stellar Q3 

The United States Bureau of Economic Analysis will publish the first preliminary estimate of the fourth-quarter Gross Domestic Product at 13:30 GMT. Analysts forecast the US economy to have expanded at a 3% annualized rate, slowing down from the 4.4% growth posted in the previous quarter.

Iran tensions and AI fears at the forefront ahead of key US data

Thursday’s scorecard shows major US Stock benchmarks closed modestly in the red amid mounting US-Iran tensions and AI disruption worries. The S&P 500 shed 19 points (0.3%) to 6,861, the Nasdaq 100 lost 101 points (0.4%) to 24,797, and the Dow Jones Industrial Average dropped 267 points (0.5%) to 49,395.

Official Trump price approaches breakout with mixed signals from traders

Official Trump (TRUMP) is trading at $3.50 at the time of writing, approaching its upper consolidation range. A breakout from this range could open the door for an upside move. On-chain data shows market indecision, with balanced flows between bulls and bears, signaling a lack of clear directional bias.