|

EUR/USD Technical Analysis: Euro dwelling in the middle-of-nowhere post-NFP
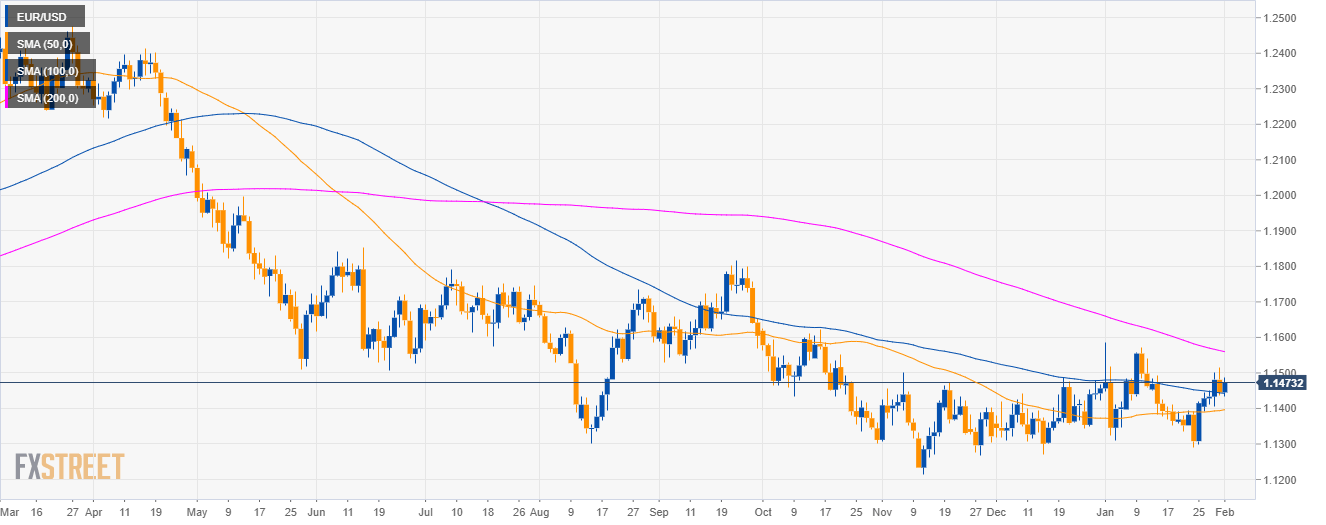
EUR/USD daily chart

  • EUR/USD is trading in a bear trend below the 200-day simple moving averages (SMAs).
  • The US nonfarm payrolls exceeded expectations with 304K vs. 165K forecast.
  • However, the price action on EUR/USD is mixed as investors are undecided where to go next.

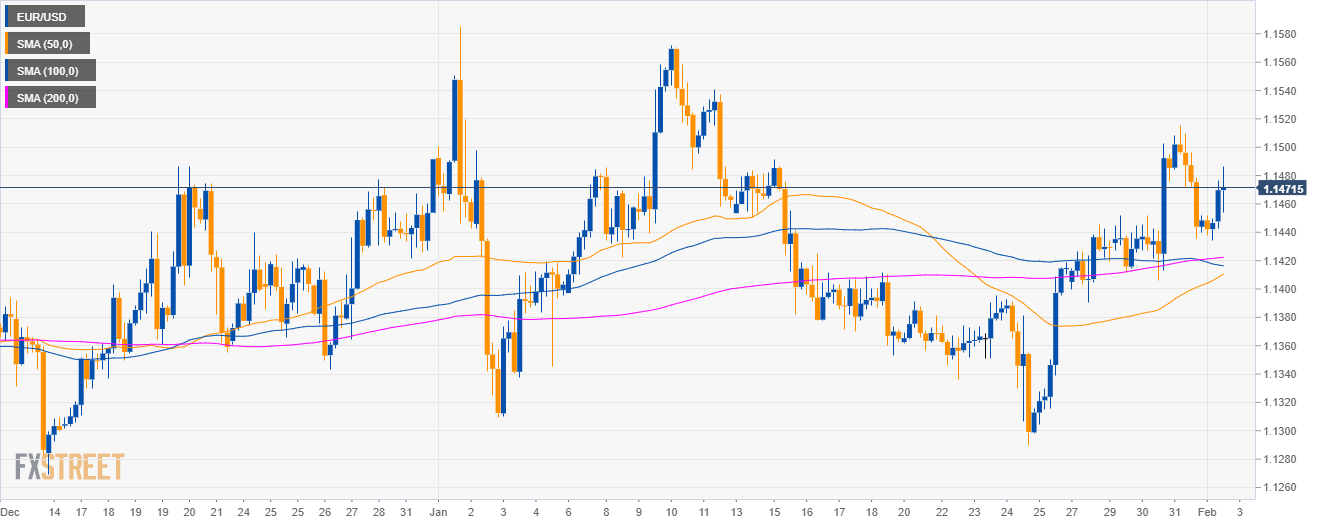
EUR/USD 4-hour chart

  • EUR/USD is trading above its main SMAs suggesting a bullish bias in the medium-term.

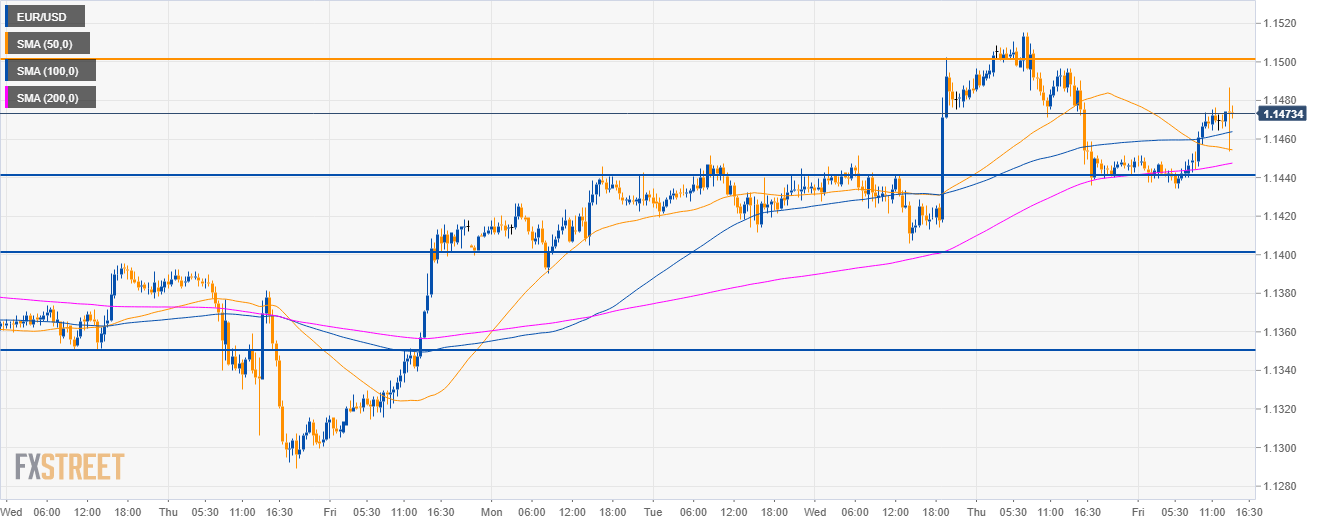
EUR/USD 30-minute chart

  • EUR/USD is trading near the daily highs after the release of the NFP. 
  • EUR/USD is above its main SMAs suggesting a slight bullish bias. The level to beat for bulls is 1.1500 figure. 
  • To the downside, bears will be looking at the 1.1440, 1.1400 and 1.1350 level. 

Additional key levels

EUR/USD

Overview:
    Today Last Price: 1.1474
    Today Daily change: +29 pips
    Today Daily change %: 0.25%
    Today Daily Open: 1.1445
Trends:
    Daily SMA20: 1.1424
    Daily SMA50: 1.1394
    Daily SMA100: 1.1444
    Daily SMA200: 1.1564
Levels:
    Previous Daily High: 1.1516
    Previous Daily Low: 1.1436
    Previous Weekly High: 1.1418
    Previous Weekly Low: 1.1289
    Previous Monthly High: 1.1586
    Previous Monthly Low: 1.1289
    Daily Fibonacci 38.2%: 1.1466
    Daily Fibonacci 61.8%: 1.1485
    Daily Pivot Point S1: 1.1415
    Daily Pivot Point S2: 1.1386
    Daily Pivot Point S3: 1.1336
    Daily Pivot Point R1: 1.1495
    Daily Pivot Point R2: 1.1545
    Daily Pivot Point R3: 1.1575

Author

Flavio Tosti

Flavio Tosti

Independent Analyst


More from Flavio Tosti
Share:

Editor's Picks

EUR/USD risks a deeper drop below 1.1750

EUR/USD keeps its vacillating mood in place as the the NA session drwas to a close on Tuesday, hovering below the 1.1800 hurdle amid acceptable gains in the US Dollar. In the meantime, market participants and the FX galaxy are expected to closely follow President Trump’s SOTU speech around 2AM GMT.
 

GBP/USD regains 1.3500 and above

GBP/USD extends its advance for the third day in a row on Tuesday, this time retesting the area beyond the 1.3500 hurdle. Cable’s uptick comes despite decent gains in the Greenback and the dovish message from the BoE’s Bailey at the UK Parliament.

Gold appears offered around $5,150

Gold is giving back a good portion of the recent multi-day rally, receding to the $5,150 zone per troy ounce amid the decent bounce in the US Dollar and mixed US Treasuty yields. In the meantime, markets’ attention remain on upcoming comments from Fed speakers.

Ripple’s DeFi shift in focus: Navigating XRPL EVM sidechain growth, XRPFi migration and liquidity
Ripple (XRP) has continued to trade under pressure, extending its decline by approximately 63% from the record high of $3.66 in July. The remittance token is trading above support at $1.35, while its upside appears limited by key supply zones, starting with $1.40, at the time of writing on Tuesday.
The Citrini report: How a debatable AI narrative can shake Wall Street

That AI-related headline alone was enough to rattle investors.US stocks slid sharply on Monday after a widely circulated Citrini Research memo outlined a hypothetical “2028 Global Intelligence Crisis”, warning that rapid AI adoption could push US unemployment into double digits as early as by mid-2028.

XRP pressured by weak ETF flows and declining retail interest

Ripple (XRP) is edging lower, trading above its intraday low of $1.32 at the time of writing on Tuesday. The decline from its weekly opening of $1.39 reflects heightened volatility in the broader cryptocurrency market, accentuated by tariff-triggered uncertainty.