|

EUR/USD technical analysis: Euro clings to weekly gains after the London close

  • The Greenback weakness is pushing EUR/USD to the 1.1160 level after the London close. 
  • The level to beat for buyers is 1.1160, followed by the 1.1191 level. 
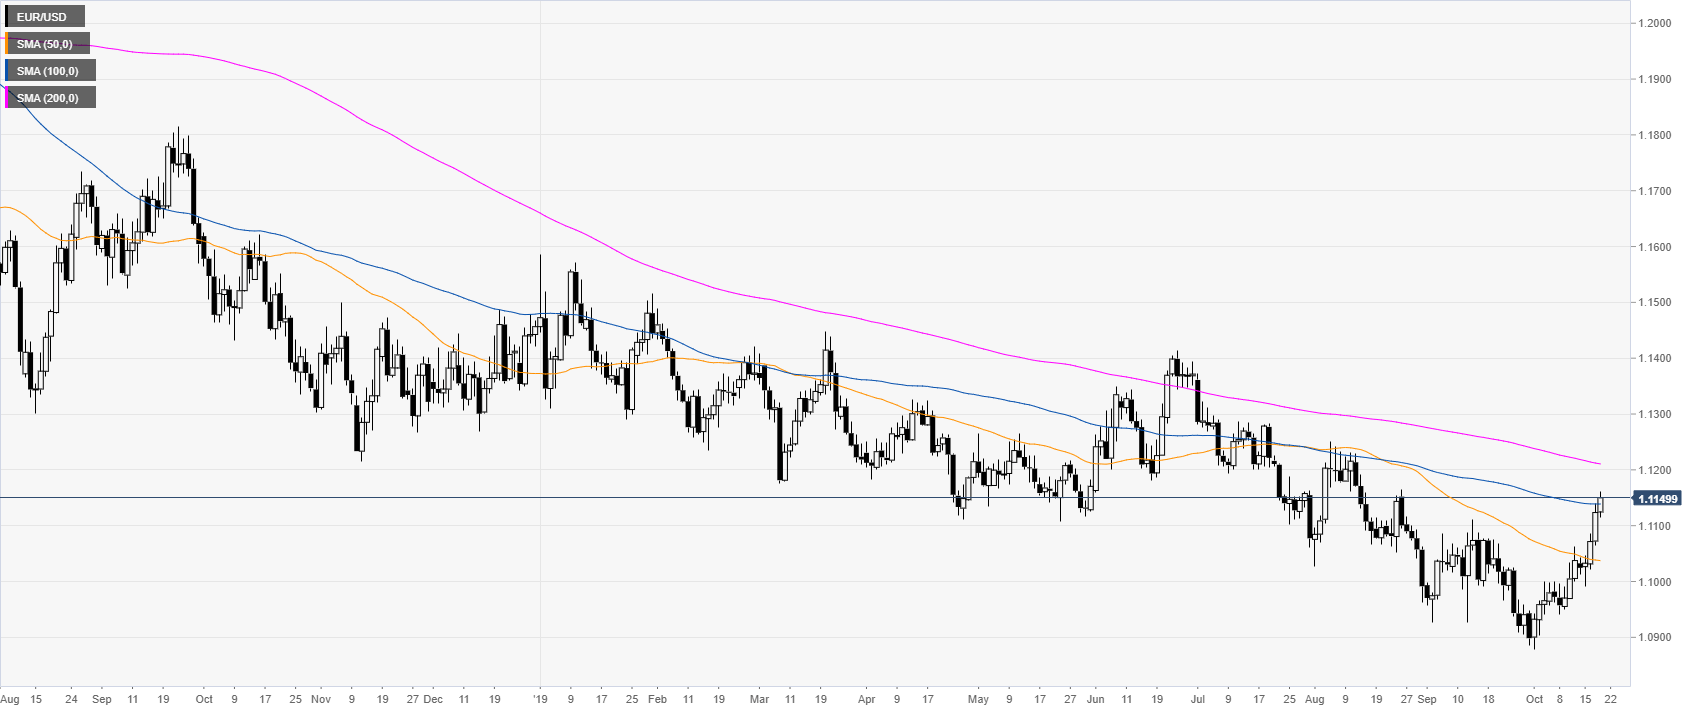
 

EUR/USD daily chart


On the daily chart, the single currency is trading in a bear trend below the 200-day simple moving averages (DSMAs). However, this Friday, the Fiber broke above the 100 DSMA, today at 1.1138. 

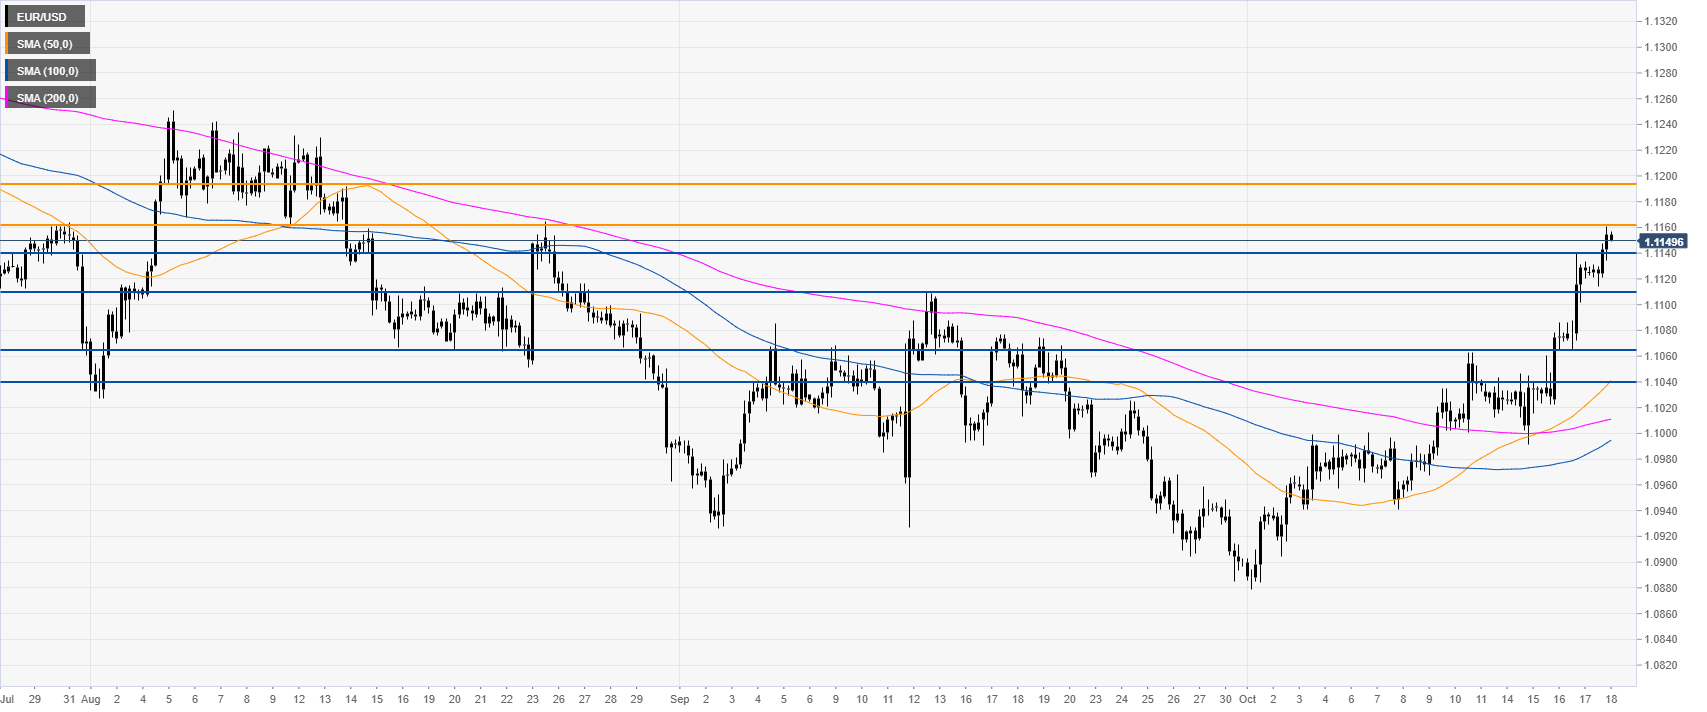
EUR/USD four-hour chart


The Euro is trading above the main SMAs, suggesting bullish momentum in the medium term. EUR/USD is clinging to October highs while trading above September highs. A breakout above 1.1160 resistance could open the gates to the 1.1191 resistances on the way up, according to the Technical Confluences Indicator.
 

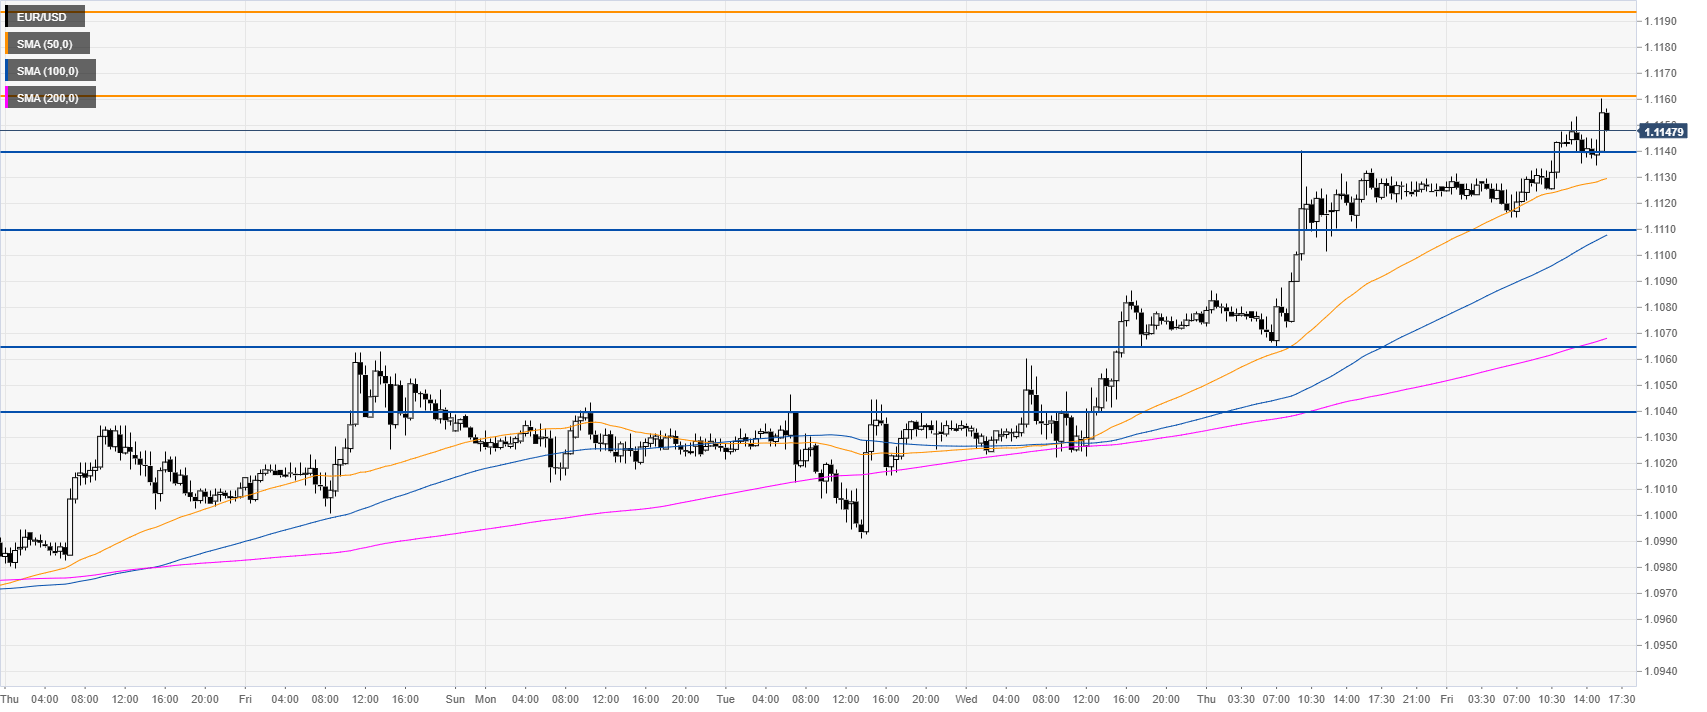
EUR/USD 30-minute chart


EUR/USD is trading above the main SMAs, suggesting bullish momentum in the near term. Support can be seen at the 1.1140 and 1.1110 price levels. 
 

Additional key levels

EUR/USD

Overview
Today last price1.1147
Today Daily Change0.0023
Today Daily Change %0.21
Today daily open1.1124
 
Trends
Daily SMA201.099
Daily SMA501.1039
Daily SMA1001.1139
Daily SMA2001.1212
 
Levels
Previous Daily High1.114
Previous Daily Low1.1065
Previous Weekly High1.1063
Previous Weekly Low1.0941
Previous Monthly High1.111
Previous Monthly Low1.0885
Daily Fibonacci 38.2%1.1112
Daily Fibonacci 61.8%1.1094
Daily Pivot Point S11.1079
Daily Pivot Point S21.1034
Daily Pivot Point S31.1004
Daily Pivot Point R11.1154
Daily Pivot Point R21.1185
Daily Pivot Point R31.123

Author

Flavio Tosti

Flavio Tosti

Independent Analyst


More from Flavio Tosti
Share:

Editor's Picks

EUR/USD weakens below 1.1700 as Middle East tensions drive US Dollar strength

The EUR/USD pair trades with mild losses around 1.1685, the lowest since late January, during the early Asian session on Tuesday. The US Dollar gathers strength against the Euro as escalating tensions in the Middle East boost safe-haven currencies. The preliminary reading of the Harmonized Index of Consumer Prices from the Eurozone will be published later on Tuesday.  

GBP/USD hovers around 1.3400 with bearish pressure intact

GBP/USD edges higher after three days of losses, trading around 1.3400 during the Asian hours on Tuesday. The technical analysis of the daily chart indicates an ongoing bearish bias, as the pair trades within a descending channel pattern.

Gold defends bids as US-Iran war continues to fuel safe-haven flows

Gold retains positive bias for the fifth consecutive day on Tuesday as rising geopolitical tensions in the Middle East continue to underpin safe-haven assets. However, a bullish US Dollar keeps the bullion below its highest level since late January, set on Monday, warranting caution before positioning for any further appreciation.

Strategy lifts holdings to 3.4% of Bitcoin's total supply amid inflows into crypto products

Strategy continued its accumulation of the top crypto last week, acquiring 3,015 BTC for $204 million amid renewed interest in crypto products after four weeks of outflows.

The market is not panicking it is repricing the probability distribution of Oil and time

At the end of the day, markets do not trade morality or geopolitics. They trade transmission channels. And the only channel that truly matters in this maelstrom runs through the price of energy and the time value of money.

Grass 20% bullish breakout defies broader market weakness

Grass (GRASS) is edging up above $0.30 at the time of writing on Monday. The token’s notable 20% intraday surge stands out amid heightened volatility in the broader crypto market.