|

EUR/USD technical analysis: 50-HMA holds the key to 1.1236/31 support-area

  • Failure to cross 1.1287/94 resistance-zone triggered the EUR/USD pair’s pullback.
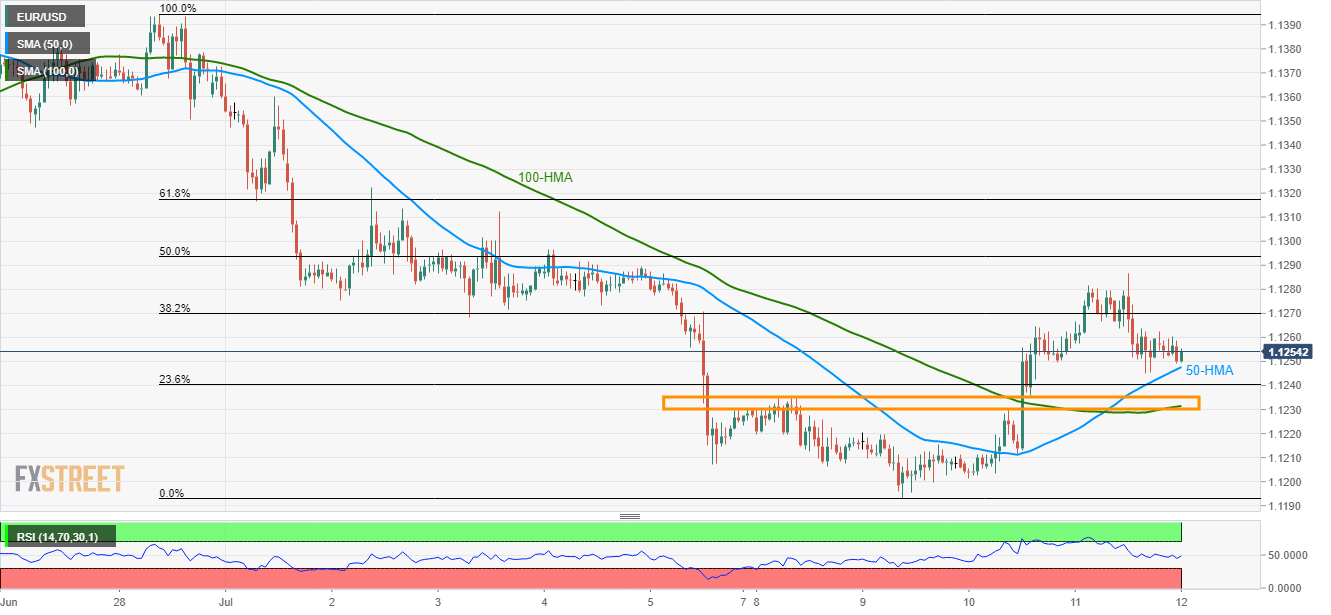
  • 100-HMA, early week tops constitute short-term key support region.

Having failed to clear 1.1287/94 resistance-area, the EUR/USD pair drops to 50-hour moving average (HMA) as it takes the rounds to 1.1250 during early Friday.

Sellers can aim for 1.1236/31 support region, including early-week high and 100-HMA, should prices decline below 1.1248 immediate support.

In a case where prices keep trading southwards past-1.1231, current month low near 1.1193 could be aimed if holding short positions.

On the contrary, 1.1287/94 area including multiple highs since early-month and 50% Fibonacci retracement of the pair’s decline since June 28 can keep the short-term upside limited.

Though, pair’s rally past-1.1294 might not refrain from questioning 61.8% Fibonacci retracement level of 1.1317 and July 01 top surrounding 1.1360.

EUR/USD hourly chart

Trend: Bearish

    1. R3 1.132
    2. R2 1.1303
    3. R1 1.1279
  1. PP 1.1262
    1. S1 1.1237
    2. S2 1.122
    3. S3 1.1196

Author

Anil Panchal

Anil Panchal

FXStreet

Anil Panchal has nearly 15 years of experience in tracking financial markets. With a keen interest in macroeconomics, Anil aptly tracks global news/updates and stays well-informed about the global financial moves and their implications.

More from Anil Panchal
Share:

Editor's Picks

EUR/USD challenges 1.1700, six-week lows

EUR/USD remains under heavy downside pressire in quite a dfrreadful start to the new trading week, putting the 1.1700 support to the test amid the marked rebound in the US Dollar. The flight-so-safety environment continues to support the Greenback following the escalating conflict in the Middle East.

GBP/USD hits new yearly lows near 1.3300

GBP/USD adds to the recent bearish tone, approaching to the key 1.3300 support to reach fresh YTD troughs against the backdrop of the robust performance of the US Dollar. Indeed, Cable’s decline comes amid the firm demand for the safe-haven space in the wake of the US and Israel attacks to Iran.

Gold shifts its attention to $5,600 on fligh-to-safety mood

Gold climbs to levels last seen in late January past the $5,400 mark per troy ounce on Monday. The yellow metal’s strong uptick remains fuelled by incresing geopolitical tensions in the Middle East and the consequent demand for safer assets.

Bitcoin on brink of breakdown amid US-Iran war

Bitcoin (BTC) remains under pressure near the key support level of $65,700. Trading at $66,400 at the time of writing on Monday, a breakdown below this critical level would suggest a deeper correction ahead.

The week ahead: Conflict in the Middle East jolts markets

Events in the Middle East are obviously dominating financial markets this morning. The Brent crude oil price is extending gains and is higher by more than 8%, stock futures are pointing lower and the gold price is higher by more than 2%. 

Pi Network Price Forecast: Core team offloads supply, weighing on PI recovery

Pi Network  hovers below $0.1700, broadly steady at press time on Monday, attempting a recovery after a 2% loss the previous day. Sunday’s decline aligned with nearly 49 million PI tokens offloaded by the Pi Foundation, implying a spike in supply pressure that capped the prevailing four-day recovery.