|

EUR/USD rises amid USD weakness following Fed's decision

  • The Fed hiked rates by 25 bps as expected to 5.25-5.50%, its highest in 22 years.
  • All eyes are now on ECB’s decision on Thursday, expected to deliver a 25 bps hike.

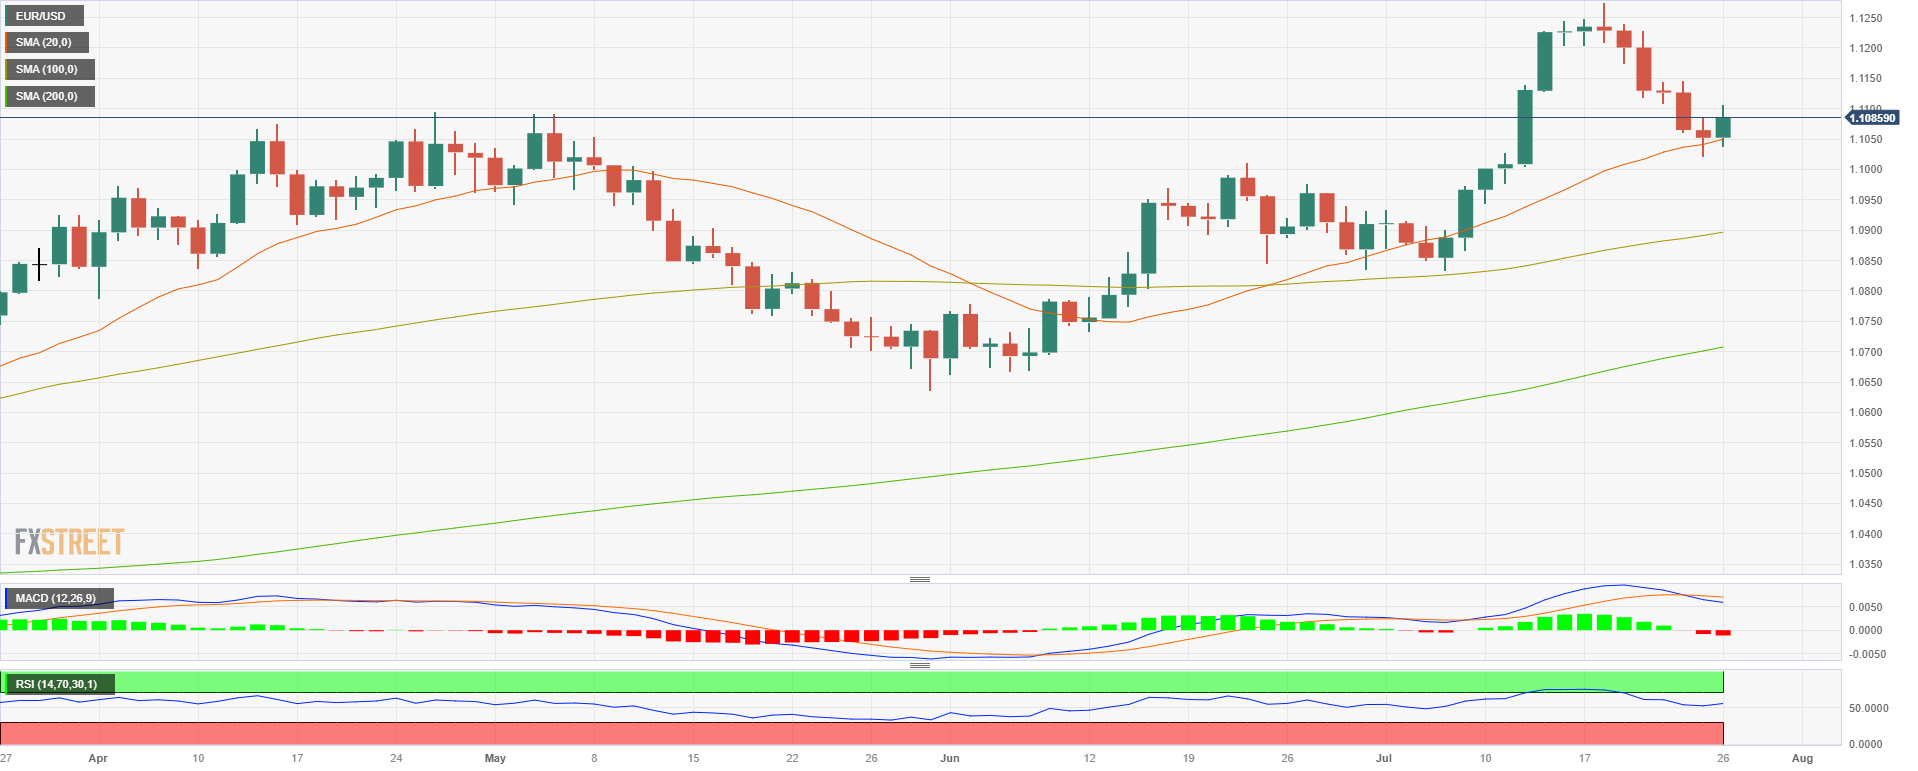
The EUR/USD is trading positive after 6 consecutive days of losses, precisely at 1.1090 and 0.37% gains during the session.

As expected, the Federal Reserve (Fed) hiked rates by 25 basis points and is positioned in the 5.25%-5.50% target. However, during the press conference, Chair Powell did not commit to a hike in September as ongoing decisions will depend on incoming data.
Regarding the economic assessment, Powell noted that economic activity and the labour market remain robust but that inflation remains too high.

That said, the DXY index fell to 101.030, showing a decrease of 0.26% on the day. Additionally, the US treasury yields on 2, 5 and 10-year are in negative territory at 4.85%, 4.11% and 3.87%, respectively, and applied further pressure on the USD.

Regarding Thursday's European Central Bank (ECB) decision, markets have largely priced in a 25 bps hike, and investors will look for clues regarding forward guidance. As for now, the odds of a hike according to the World Interest Rate Possibilities (WIRP) in Septmeber fell below 50%, but in October and December are largely priced in, so messaging will be key.

EUR/USD Levels to watch

According to the daily chart, the technical outlook for the EUR/USD has improved as indicators are starting to gain strength but still, the bears are holding their ground.  The Relative Strength Index (RSI) with a slightly upward slope to the north, while the Moving Average Convergence Divergence (MACD) is still in negative territory, printing red bars. That being said, the bulls managed to defend the 20-day Simple Moving Average (SMA) so outlook for the EUR/USD is bright on the bigger picture.

Resistance levels: 1.1100, 1.1150,1.1190. 
Support levels: 1.1050 (20-day SMA), 1.1030, 1.1000.

EUR/USD Daily chart
EUR/USD

Overview
Today last price1.1086
Today Daily Change0.0034
Today Daily Change %0.31
Today daily open1.1052
 
Trends
Daily SMA201.1041
Daily SMA501.0901
Daily SMA1001.0891
Daily SMA2001.0701
 
Levels
Previous Daily High1.1087
Previous Daily Low1.1021
Previous Weekly High1.1276
Previous Weekly Low1.1108
Previous Monthly High1.1012
Previous Monthly Low1.0662
Daily Fibonacci 38.2%1.1046
Daily Fibonacci 61.8%1.1062
Daily Pivot Point S11.102
Daily Pivot Point S21.0987
Daily Pivot Point S31.0954
Daily Pivot Point R11.1086
Daily Pivot Point R21.1119
Daily Pivot Point R31.1152

Author

Patricio Martín

Patricio is an economist from Argentina passionate about global finance and understanding the daily movements of the markets.


More from Patricio Martín
Share:

Editor's Picks

GBP/USD stays defensive near 1.3450 amid Mideast uncertainty

GBP/USD drifts lower to near 1.3460 in European trading on Thursday. Conflicting rhetoric from US and Iranian officials about a potential deal fuels market concerns, allowing the US Dollar to attract some haven demand. Next of note for the major is the US Initial Jobless Claims report, while Mideast headlines will remain in play.

EUR/USD turns lower toward 1.1500 as USD finds demand

EUR/USD is turning south toward 1.1500 in the European session on Thursday, pressured by a modest US Dollar rebound. Markets stay wary about the prospects of a US-Iran peace deal and the reopening of the Strait of Hormuz, keeping the safe-haven USD underpinned. The focus is now on the US Jobless Claims data, following weak Eurozone Retail Sales report.

How Wall Street rigs the game [Video]

In this week’s Live from the Vault, Andrew Maguire is joined by Peter Antico and Sean Stone to discuss the Paradigm of Money - an in-depth expose of financial market corruption, from naked shorting to the two-tier system that protects Wall Street.

Top Altcoins: Ripple, Cardano, and Solana vulnerable to deeper losses

Ripple, Cardano, and Solana are trading in the red on Thursday, facing downside pressure. The technical outlook for altcoins is bearish, as XRP risks falling below $1.00, ADA is eyeing the 50-day Exponential Moving Average at $0.1766, and SOL remains capped below a cluster of resistance levels.

AI defies the disinflationary playbook: Why lower oil prices might not be enough to cool core inflation
The global economic landscape has been fixated on the Middle East since the US-Iran war started in late February, reacting to significant changes in crude Oil prices and assessing how they could influence inflation dynamics and growth outlook.
9-3: Is the Federal Reserve’s vote tally Warsh's new forward guidance?
The rate did not move. Neither did the statement, and that’s the more interesting fact. Set the July 29 Federal Open Market Committee (FOMC) statement beside the one issued on June 17, and the two documents are identical apart from a single verb and a paragraph at the bottom naming three dissenters.












