- EUR/USD could look to reclaim the ascending channel and retest the 1.1573 level — its highest since November 2021.
- Daily chart analysis points to a weakening bullish bias following a break below the ascending channel.
- A drop beneath the nine-day EMA at 1.1326 may pave the way for a deeper pullback toward the 50-day EMA support near 1.0944.
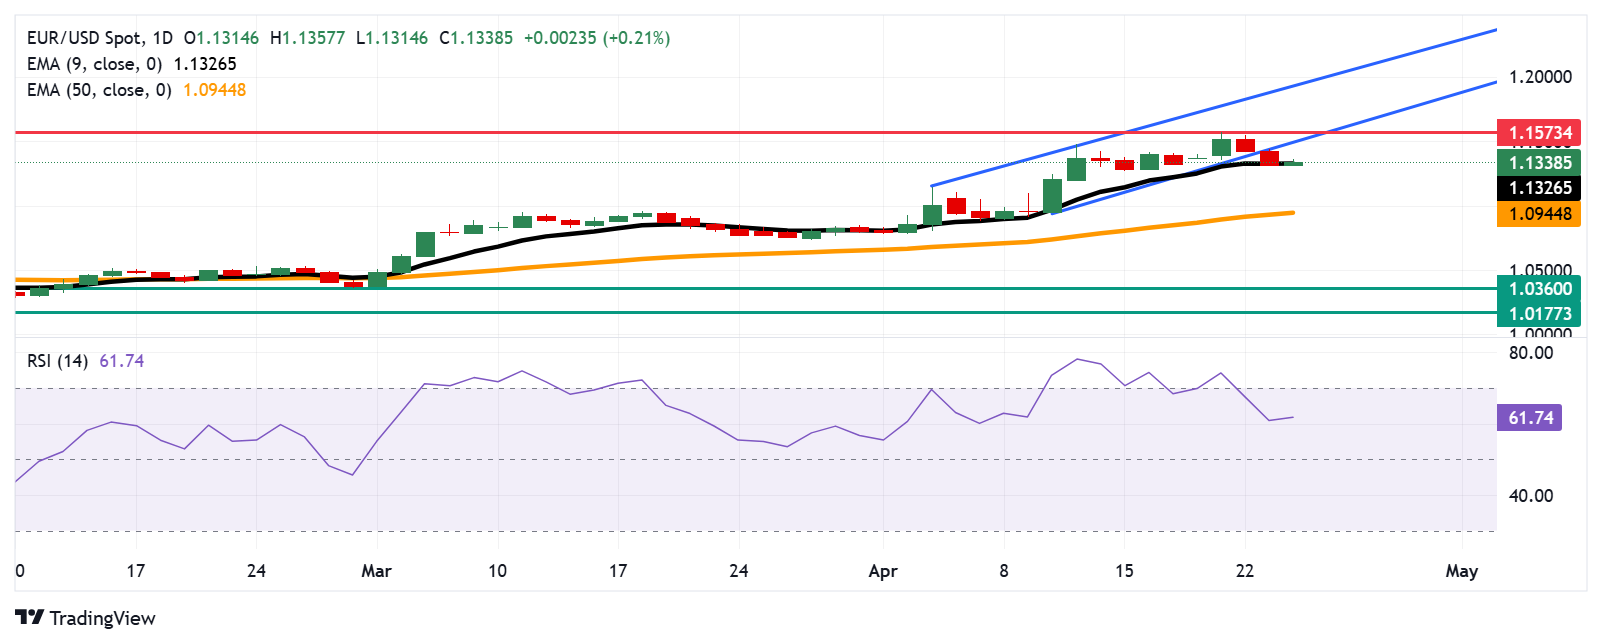
EUR/USD pauses its two-day decline, hovering near 1.1340 during Thursday’s Asian session. Daily chart technical analysis indicates a weakening bullish bias, as the pair has slipped below the ascending channel pattern.
Additionally, the EUR/USD pair continues to trade just above the nine-day Exponential Moving Average (EMA), indicating firm short-term bullish momentum. The 14-day Relative Strength Index (RSI) also stays above the 50 level, reinforcing the sustained bullish bias.
On the upside, the EUR/USD pair may attempt to re-enter the ascending channel and retest the April 21 high of 1.1573 — its strongest level since November 2021. A successful return to the channel could restore bullish momentum and potentially drive the pair toward the channel’s upper boundary near the 1.1930 mark.
The pair is testing key support at the nine-day EMA near 1.1326. A break below this level could erode the bullish bias and open the door for a move toward the 50-day EMA around 1.0944. Further downside pressure may weaken medium-term momentum, potentially extending the decline toward the six-week low of 1.0360, last seen on February 28.
EUR/USD: Daily Chart
Euro PRICE Today
The table below shows the percentage change of Euro (EUR) against listed major currencies today. Euro was the strongest against the US Dollar.
USD | EUR | GBP | JPY | CAD | AUD | NZD | CHF | |
---|---|---|---|---|---|---|---|---|
USD | -0.20% | -0.11% | -0.41% | -0.06% | 0.01% | -0.12% | -0.24% | |
EUR | 0.20% | 0.09% | -0.23% | 0.14% | 0.19% | 0.07% | -0.04% | |
GBP | 0.11% | -0.09% | -0.28% | 0.05% | 0.12% | -0.02% | -0.13% | |
JPY | 0.41% | 0.23% | 0.28% | 0.36% | 0.44% | 0.27% | 0.23% | |
CAD | 0.06% | -0.14% | -0.05% | -0.36% | 0.11% | -0.05% | -0.17% | |
AUD | -0.01% | -0.19% | -0.12% | -0.44% | -0.11% | -0.12% | -0.23% | |
NZD | 0.12% | -0.07% | 0.02% | -0.27% | 0.05% | 0.12% | -0.12% | |
CHF | 0.24% | 0.04% | 0.13% | -0.23% | 0.17% | 0.23% | 0.12% |
The heat map shows percentage changes of major currencies against each other. The base currency is picked from the left column, while the quote currency is picked from the top row. For example, if you pick the Euro from the left column and move along the horizontal line to the US Dollar, the percentage change displayed in the box will represent EUR (base)/USD (quote).
BRANDED CONTENT
If you're looking for the best brokers to trade the EUR/USD pair, explore our selected options. Knowing each broker’s strengths will help you find the ideal fit for your trading strategy.
Information on these pages contains forward-looking statements that involve risks and uncertainties. Markets and instruments profiled on this page are for informational purposes only and should not in any way come across as a recommendation to buy or sell in these assets. You should do your own thorough research before making any investment decisions. FXStreet does not in any way guarantee that this information is free from mistakes, errors, or material misstatements. It also does not guarantee that this information is of a timely nature. Investing in Open Markets involves a great deal of risk, including the loss of all or a portion of your investment, as well as emotional distress. All risks, losses and costs associated with investing, including total loss of principal, are your responsibility. The views and opinions expressed in this article are those of the authors and do not necessarily reflect the official policy or position of FXStreet nor its advertisers. The author will not be held responsible for information that is found at the end of links posted on this page.
If not otherwise explicitly mentioned in the body of the article, at the time of writing, the author has no position in any stock mentioned in this article and no business relationship with any company mentioned. The author has not received compensation for writing this article, other than from FXStreet.
FXStreet and the author do not provide personalized recommendations. The author makes no representations as to the accuracy, completeness, or suitability of this information. FXStreet and the author will not be liable for any errors, omissions or any losses, injuries or damages arising from this information and its display or use. Errors and omissions excepted.
The author and FXStreet are not registered investment advisors and nothing in this article is intended to be investment advice.
Recommended content
Editors’ Picks

EUR/USD struggles to retain 1.1500 as USD gains traction
EUR/USD hovers around the 1.1500 level in the American session on Friday. The US Dollar surges despite dovish comments from Fed Governor Waller, supporting a rate cut as soon as July. The mood sours as investors weigh Middle East developments.

GBP/USD dives below 1.3500 after weak UK data, resurgent USD
GBP/USD turned red for the day and approaches the 1.3450 area as the week comes to an end. Earlier in the day, the UK reported weak Retail Sales figures, although the ongoing slump seems related to renewed risk aversion fueling safe-haven US Dollar demand.

Gold surges above $3,3360 as fears kick in
Gold gathers near-term momentum and trades near $3,370 ahead of the weekly close, as risk sentiment took a turn to the south. Following a positive start, Wall Street turned south. Middle East tensions and massive back-and-forth missile exchanges between Iran and Israel seem to be behind the ongoing run to safety.

Ripple Price Prediction: How tokenized treasuries could accelerate XRP to $10 by end-2025
Ondo Finance launched tokenized treasuries on the XRP Ledger in June, paving the way for seamless institutional adoption. The market capitalization of tokenized treasuries has grown to $5.9 billion despite market uncertainty over US tariffs.

Weekly focus: War and risk of escalation weigh on market sentiment
The war between Israel and Iran and the risk of further escalation weighed on markets this week. Equity markets largely traded in red and US treasury yields slid lower. That said, markets were by no means in full risk-off sentiment.

The Best brokers to trade EUR/USD
SPONSORED Discover the top brokers for trading EUR/USD in 2025. Our list features brokers with competitive spreads, fast execution, and powerful platforms. Whether you're a beginner or an expert, find the right partner to navigate the dynamic Forex market.