|

EUR/USD Price Analysis: Volatile action looks likely as US debt-ceiling raise proposal approved

  • EUR/USD is trading sideways above 1.0700, and remains lackluster despite approval of the US debt-ceiling raise.
  • In spite of the German recession, the ECB is expected to raise interest rates further.
  • EUR/USD has slipped below the 61.8% Fibonacci retracement at 1.0738.

The EUR/USD pair is showing a back-and-forth action above the round-level support of 1.0700 in the Asian session. The major currency pair is expected to remain in action as the proposal of raising the $31.4 trillion US borrowing limit has been approved for two years after compromising for the budget’s spending initiatives by Democrats.

The US Dollar Index (DXY) is facing barricades in extending its recovery above 104.30 despite the Federal Reserve (Fed) is expected to continue its policy-tightening regime after observing persistence in US households’ spending.

Despite a record of recession in the German economy after showing contraction in Gross Domestic Product (GDP) numbers consecutively for two quarters, the European Central Bank (ECB) is expected to raise interest rates further to tame stubborn inflation. ECB President Christine Lagarde has already announced that more than one interest rate hike is anticipated to bring down inflation.

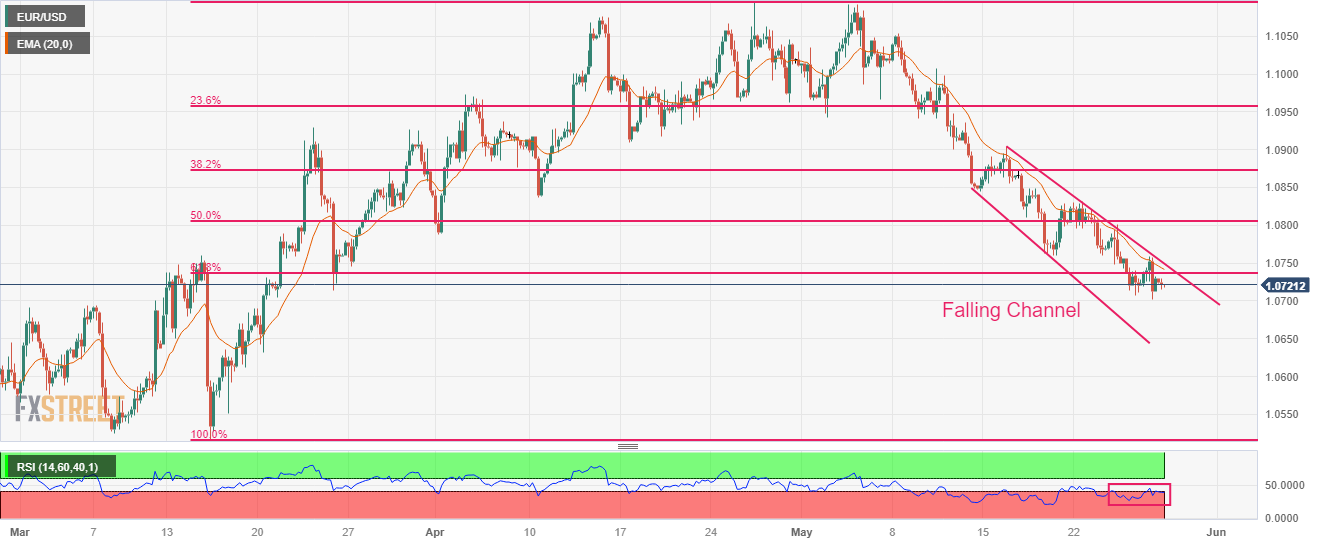
EUR/USD has slipped below the 61.8% Fibonacci retracement (plotted from March 15 low at 1.0516 to April 26 high at 1.1095) at 1.0738 on a four-hour scale. The 20-period Exponential Moving Average (EMA) at 1.0740 is acting as a strong barrier for the Euro bulls. The asset is auctioning in a Falling Channel in which each pullback is considered as a selling opportunity by market participants.

The Relative Strength Index (RSI) (14) is oscillating in the bearish range of 20.00-40.00, indicating the continuation of the bearish momentum.

The downside move will resume if the shared currency pair drops below the round-level support of 1.0700. This will drag the asset toward March 13 low at 1.0650 followed by March 03 low at 1.0588.

On the flip side, a recovery move above May 24 high around 1.0800 would push the ball in Euro’s court. A solid recovery above 1.0800 would drive the asset toward May 18 high at 1.0848 and May 16 high at 1.0904.

EUR/USD four-hour chart

EUR/USD

Overview
Today last price1.072
Today Daily Change-0.0005
Today Daily Change %-0.05
Today daily open1.0725
 
Trends
Daily SMA201.0886
Daily SMA501.0904
Daily SMA1001.0816
Daily SMA2001.0483
 
Levels
Previous Daily High1.0759
Previous Daily Low1.0702
Previous Weekly High1.0831
Previous Weekly Low1.0702
Previous Monthly High1.1095
Previous Monthly Low1.0788
Daily Fibonacci 38.2%1.0724
Daily Fibonacci 61.8%1.0737
Daily Pivot Point S11.0698
Daily Pivot Point S21.0671
Daily Pivot Point S31.0641
Daily Pivot Point R11.0755
Daily Pivot Point R21.0785
Daily Pivot Point R31.0812

Author

Sagar Dua

Sagar Dua

FXStreet

Sagar Dua is associated with the financial markets from his college days. Along with pursuing post-graduation in Commerce in 2014, he started his markets training with chart analysis.

More from Sagar Dua
Share:

Editor's Picks

AUD/USD consolidates above 0.7000/two-month low; bearish potential intact

The AUD/USD pair oscillates in a narrow range during the Asian session, and moves little following the release of mixed inflation figures from China. Spot prices currently trade around the 0.7025 region, nearly unchanged for the day, and remain within striking distance of a nearly two-month low set on Tuesday. Renewed hostilities between the US and Iran temper hopes for a deal to end the over three-month-old war.

Japanese Yen languishes despite wholesale inflation accelerates in May

USD/JPY flatlines after experiencing volatility, trading around 160.40 during the Asian hours on Wednesday. The pair continues to hold its ground, reflecting a struggling Japanese Yen that has failed to find support despite a massive acceleration in wholesale inflation. Driven by surging energy costs linked to the ongoing Middle East conflict, Japan’s Producer Price Index jumped 6.3% year-over-year in May. This hot printing comfortably outpaced April’s upwardly revised 5.3% figure and surpassed market consensus of 5.5%, marking the fastest pace of wholesale price growth in three years.

Gold plummets below $4,200 amid US‑Iran tensions ahead of US CPI

Gold extends the recent breakdown momentum below a technically significant 200-day Simple Moving Average (SMA) and drops to a fresh low since March 23, further below the $4,200 mark during the Asian session. Crude Oil prices rise amid renewed hostilities between the US and Iran, fueling inflation fears and bolstering bets for more hawkish central banks.

Bitcoin remains vulnerable, Ethereum weakens further, XRP signals more downside

Bitcoin, Ethereum, and Ripple remain under pressure mid-week, as the broader cryptocurrency market struggles to regain recovery momentum after last week’s massive correction. BTC struggles below $62,000, ETH continues to weaken below $1,650, while XRP’s momentum indicators remain biased toward further downside.

US CPI data set to show inflation at three-year high in May, backing Fed hawkish tilt

The US Bureau of Labor Statistics will publish the May Consumer Price Index (CPI) data on Wednesday. The report is expected to show another step up in consumer inflation, driven by the persistently high Oil prices due to the ongoing crisis in the Middle East.

The US economy defies the rules: 100 days into the Oil shock and the recession signal is still missing

More than three months after the start of the Iran war and the resulting disruption to global energy markets, the US economy continues to display remarkable resilience. The conflict has triggered a sharp rise in Oil prices, reignited inflationary pressures and fueled widespread concerns about a potential economic slowdown.