|

EUR/USD Price Analysis: The decline now looks to the 55-day SMA

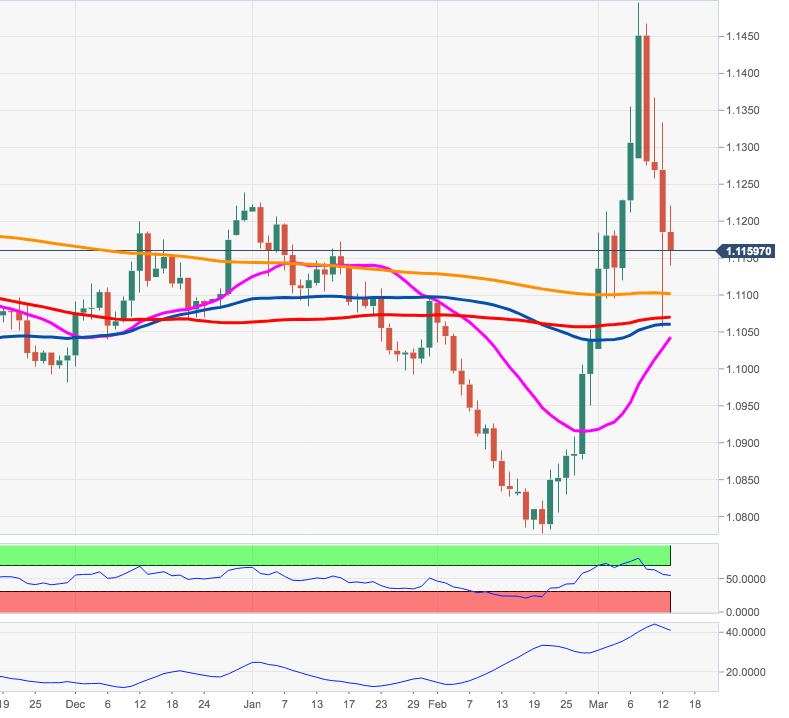
  • EUR/USD remains under pressure and approaches the 200-day SMA.
  • Further south emerges the 55-day SMA in the 1.1060 area.

EUR/USD remains well on the defensive so far this week and is now trading at shouting distance from the critical 200-day SMA in the 1.1100 zone.

Another break below this level should accelerate losses to the 55-day SMA in the 1.1055/60 band.

Looking at the broader picture, the outlook on the spot stays bullish while above the 55-day SMA, today at 1.1057.

EUR/USD daily chart

EUR/USD

Overview
Today last price1.1155
Today Daily Change82
Today Daily Change %-0.27
Today daily open1.1185
 
Trends
Daily SMA201.1037
Daily SMA501.1047
Daily SMA1001.1069
Daily SMA2001.1102
 
Levels
Previous Daily High1.1334
Previous Daily Low1.1056
Previous Weekly High1.1355
Previous Weekly Low1.1027
Previous Monthly High1.1089
Previous Monthly Low1.0778
Daily Fibonacci 38.2%1.1162
Daily Fibonacci 61.8%1.1227
Daily Pivot Point S11.1049
Daily Pivot Point S21.0913
Daily Pivot Point S31.0771
Daily Pivot Point R11.1327
Daily Pivot Point R21.147
Daily Pivot Point R31.1606

Author

Pablo Piovano

Born and bred in Argentina, Pablo has been carrying on with his passion for FX markets and trading since his first college years.

More from Pablo Piovano
Share:

Editor's Picks

EUR/USD: Cautiously optimistic near 1.1550 ahead of the ECB

EUR/USD extends its weekly recovery for the third day in a row on Wednesday, navigating in a sidelined fashion around 1.1550 on the back of humble losses in the US Dollar. In the meantime, market participants continue to closely follow developments in the Middle East while slowly gearing up for the ECB gathering on Thursday.

GBP/USD recedes from tops, hovers around 1.3400

GBP/USD could not sustain the initial bull run and is now slipping back toward the 1.3400 neighbourhood on Wednesday. Cable’s continuation of the ongoing leg higher follows mild selling pressure on the Greenback, despite steady uncertainty on the geopolitical front and elevated US inflation.

Gold bleeding continues as Middle East crisis escalates, Fed hike coming

Gold is accelerating its downward trends and approaches the area of $4,100 per troy ounce on Wednesday, where the 2026 bottom sits so far. The persistent decline in the precious metal almost exclusively follows the swelling opinion that the Fed will keep a cautious stance in H2, a view that was reinforced following earlier US CPI data.

$1,500: Why Ethereum just crashed 20% despite spot markets barely selling
Ethereum (ETH) recently suffered one of its sharpest declines of 2026, dropping more than 20% and briefly testing the $1,500 area. While the sell-off appeared to reflect broader market fears, derivatives and on-chain data suggest a more complex story may be unfolding beneath the surface.
Brutal sell-off: Silver deepens months-long slide, refocusing on $60

Silver has never been known for its calm temperament. The precious metal can spend weeks grinding higher before suddenly giving back months of gains in a matter of days. That volatile reputation has been on full display in recent weeks.

The US economy defies the rules: 100 days into the Oil shock and the recession signal is still missing

More than three months after the start of the Iran war and the resulting disruption to global energy markets, the US economy continues to display remarkable resilience. The conflict has triggered a sharp rise in Oil prices, reignited inflationary pressures and fueled widespread concerns about a potential economic slowdown.