|

EUR/USD Price Analysis: The 1.2100 area is seen holding the downside

  • EUR/USD accelerates the downside well below 1.2200.
  • Bets rise on a probable visit to the 1.2100 neighbourhood.

Sellers regain the upper hand and drag EUR/USD back to the low-1.2100s at the end of the week.

The continuation of the downtrend looks likely in the very near term at least. That said, a move further south should meet the next contention at the so far monthly lows near 1.2100 the figure.

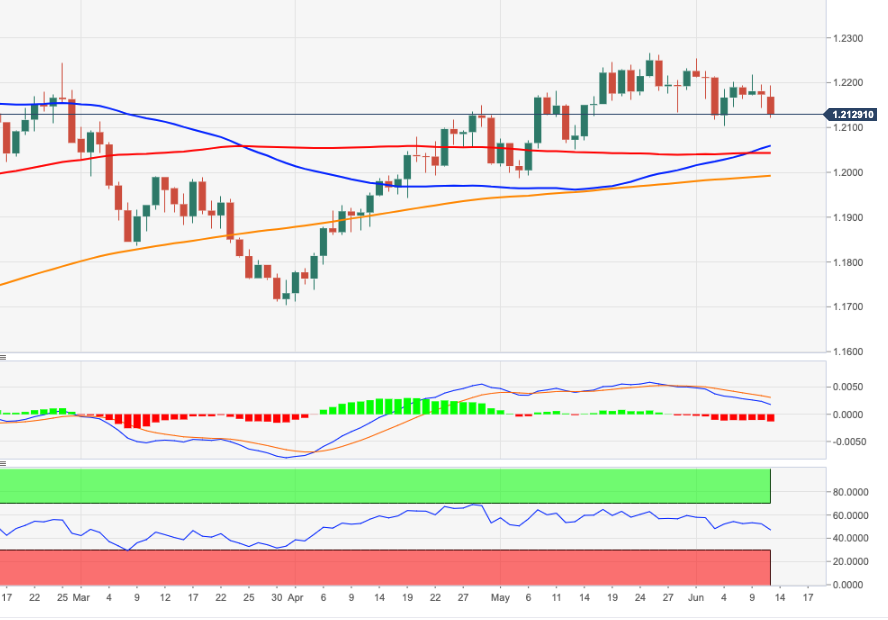
Extra losses are seen testing the minor support at the 50-day SMA, today at 1.2088 ahead of the Fiibo level at 1.2064.

On the broader view, the constructive stance on EUR/USD is forecast to remain intact as long as it trades above the 200-day SMA, today at 1.1987.

The ongoing correction follows the recent bearish divergence in the daily RSI, as it did not confirm the late May peaks near 1.2270.

EUR/USD daily chart

EUR/USD

Overview
Today last price1.2128
Today Daily Change71
Today Daily Change %-0.44
Today daily open1.2181
 
Trends
Daily SMA201.2186
Daily SMA501.2075
Daily SMA1001.2043
Daily SMA2001.1989
 
Levels
Previous Daily High1.2218
Previous Daily Low1.2171
Previous Weekly High1.2254
Previous Weekly Low1.2104
Previous Monthly High1.2266
Previous Monthly Low1.1986
Daily Fibonacci 38.2%1.22
Daily Fibonacci 61.8%1.2189
Daily Pivot Point S11.2162
Daily Pivot Point S21.2143
Daily Pivot Point S31.2115
Daily Pivot Point R11.2209
Daily Pivot Point R21.2237
Daily Pivot Point R31.2256

Author

Pablo Piovano

Born and bred in Argentina, Pablo has been carrying on with his passion for FX markets and trading since his first college years.

More from Pablo Piovano
Share:

Markets move fast. We move first.

Orange Juice Newsletter brings you expert driven insights - not headlines. Every day on your inbox.

By subscribing you agree to our Terms and conditions.

Editor's Picks

EUR/USD: Bulls pray for a dovish Fed

EUR/USD has finally taken a breather after a pretty energetic climb. The pair broke above 1.1680 in the second half of the week, reaching its highest levels in around two months before running into some selling pressure. Even so, it has gained almost two cents from the late-November dip just below 1.1500 the figure.

GBP/USD trims gains, recedes toward 1.3320

GBP/USD is struggling to keep its daily advance, coming under fresh pressure and retreating to the 1.3320 zone following a mild bullish attempt in the Greenback. Even though US consumer sentiment surprised to the upside, the US Dollar isn’t getting much love, as traders are far more interested in what the Fed will say next week.

Gold: Bullish momentum fades despite broad USD weakness

After rising more than 3.5% in the previous week, Gold has entered a consolidation phase and fluctuated at around $4,200. The Federal Reserve’s interest rate decision and revised Summary of Economic Projections, also known as the dot plot, could trigger the next directional move in XAU/USD. 

Week ahead: Rate cut or market shock? The Fed decides

Fed rate cut widely expected; dot plot and overall meeting rhetoric also matter. Risk appetite is supported by Fed rate cut expectations; cryptos show signs of life. RBA, BoC and SNB also meet; chances of surprises are relatively low. Dollar weakness could linger; both the aussie and the yen best positioned to gain further. Gold and oil eye Ukraine-Russia developments; a peace deal remains elusive.

Week ahead – Rate cut or market shock? The Fed decides

Fed rate cut widely expected; dot plot and overall meeting rhetoric also matter. Risk appetite is supported by Fed rate cut expectations; cryptos show signs of life. RBA, BoC and SNB also meet; chances of surprises are relatively low.

Ripple faces persistent bear risks, shrugging off ETF inflows

Ripple is extending its decline for the second consecutive day, trading at $2.06 at the time of writing on Friday. Sentiment surrounding the cross-border remittance token continues to lag despite steady inflows into XRP spot ETFs.