|

EUR/USD Price Analysis: Tests the upper boundary around the level of 1.0800

  • EUR/USD could test the upper boundary of the symmetrical triangle.
  • Breaking above the upper boundary could potentially shift momentum toward a bullish trend.
  • A breach below the 14-day EMA at 1.0752 could prompt the pair to test the psychological threshold of 1.0700.

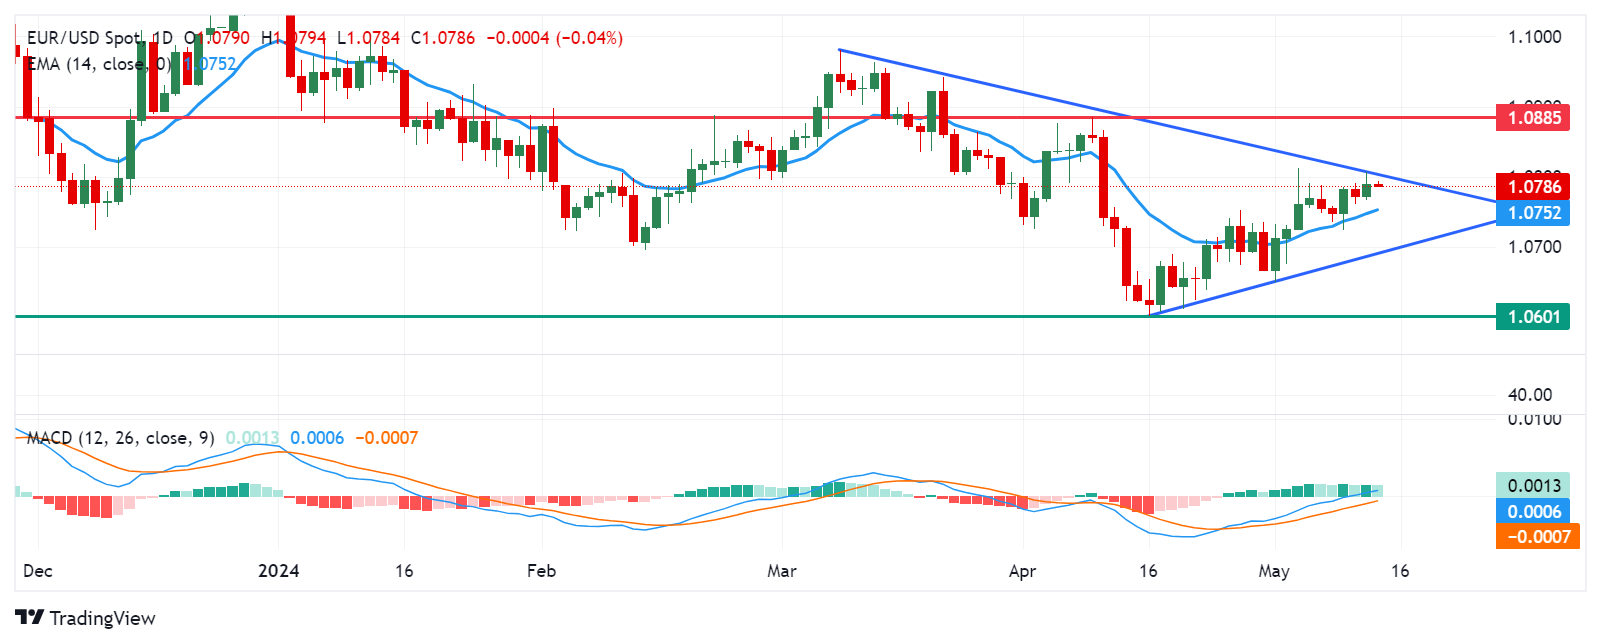
EUR/USD has recovered its recent gains registered in the previous session, trading around 1.0780 during the Asian session on Tuesday. From a technical perspective, analysis indicates a sideways trend for the pair as it continues to lie within the symmetrical triangle. A surpassing of the upper boundary could shift the momentum toward a bullish trend.

However, the momentum indicator Moving Average Convergence Divergence (MACD) indicates an upward momentum for the EUR/USD pair. While it is positioned above the centerline, there is a divergence observed above the signal line. If the signal line crosses over the centerline, it would reinforce the bullish sentiment.

The EUR/USD pair faces an immediate barrier at the upper boundary of the symmetrical triangle aligned with the psychological level of 1.0800. A break above this level could support the pair to test April’s high of 1.0885.

On the downside, key support for the EUR/USD pair is anticipated around the 14-day Exponential Moving Average (EMA) at 1.0752. A break below the latter could lead the pair to navigate the region around the psychological threshold of 1.0700, coinciding with the lower boundary of the symmetrical triangle around the level of 1.0690. Further support levels may emerge around April’s low at 1.0601.

EUR/USD: Daily Chart
EUR/USD

Overview
Today last price1.0785
Today Daily Change-0.0005
Today Daily Change %-0.05
Today daily open1.079
 
Trends
Daily SMA201.0714
Daily SMA501.0787
Daily SMA1001.0828
Daily SMA2001.0791
 
Levels
Previous Daily High1.0807
Previous Daily Low1.0766
Previous Weekly High1.0791
Previous Weekly Low1.0724
Previous Monthly High1.0885
Previous Monthly Low1.0601
Daily Fibonacci 38.2%1.0791
Daily Fibonacci 61.8%1.0782
Daily Pivot Point S11.0768
Daily Pivot Point S21.0747
Daily Pivot Point S31.0727
Daily Pivot Point R11.0809
Daily Pivot Point R21.0828
Daily Pivot Point R31.085

Author

Akhtar Faruqui

Akhtar Faruqui is a Forex Analyst based in New Delhi, India. With a keen eye for market trends and a passion for dissecting complex financial dynamics, he is dedicated to delivering accurate and insightful Forex news and analysis.


More from Akhtar Faruqui
Share:

Editor's Picks

AUD/USD consolidates above 0.7000; remains close to monthly top

AUD/USD holds steady above 0.7000 during the Asian session on Friday, trading just below the previous day's monthly low amid diverging forces. A hawkish RBA continues to support the Aussie, while the recent decline in US bond yields keeps the US Dollar depressed near a three-week low. However, oil-driven inflation fears reinforce Fed hike bets, which, along with geopolitical risks, could benefit the safe-haven buck and cap the currency pair.

USD/JPY bounces off one-month low; climbs to 157.00 amid reviving USD demand

USD/JPY rebounds from the 156.00 neighborhood, or a one-month low touched during Friday’s Asian session, with bulls looking to extend momentum beyond 157.00 amid the emergence of some US Dollar buying. Meanwhile, Japan's National CPI rose to a nine-month peak and reaffirmed BoJ rate-hike bets, which could support the Japanese Yen and cap gains for the currency pair.

Gold stalls recovery from three-month low as Fed hike bets and USD uptick cap gains

Gold struggles to capitalize on a modest intraday bounce from levels below the $4,000 psychological mark, or a three-month low set during the Asian session, and sticks to a negative tone for the second straight day. The Federal Reserve recently signaled that there is no urgency to raise interest rates. Traders, however, are still pricing in around an 80% chance that the US central bank will raise borrowing costs again at its December policy meeting.

Bitcoin, Ethereum, and Ripple rebound as major support levels cap recent sell-off

Bitcoin, Ethereum and Ripple rebound modestly on Friday after correcting and testing their key support zone the previous day. BTC holds the 50-day EMA, ETH finds support around the 100-day EMA, while XRP holds the horizontal floor near $1.300. The price action of these top three cryptocurrencies suggests a recovery if this critical support zone holds; a decisive close below these levels suggests a deeper correction.

The week ahead – UK budget, Shell, BP and HSBC and NatWest results
Financial markets have undergone another turbulent week with concerns about public sector debt levels, the impact of energy policy and higher oil and gas prices, and what events in France might mean for the UK economy going forward.
What November 3 means for the Fed's rate path and the US Dollar

The USD faces a decisive period ahead of the November 3 midterm elections. While markets anticipate another interest rate increase from the Fed in December, the battle for control of Congress could reshape fiscal policy expectations and, indirectly, the path of US monetary policy in 2027.