|

EUR/USD Price Analysis: Stumbled to two-month low around 1.0700

  • EUR/USD dips to 1.0707 amidst soaring US Treasury bond yields, but mixed market sentiment prevents a steeper fall.
  • The pair could witness further losses if sellers successfully reclaim the 1.0700 mark, shifting the bias downward.
  • Staying above 1.0700 could lead to a EUR/USD comeback, with 1.0900 in sight if key resistance levels are broken.

EUR/USD hit a new two-month low at around 1.0707, though it remains neutral to downward biased unless the pair suffers more weakness, which could send the EUR/USD sinking below the 1.0700 mark toward the 200-day Exponential Moving Average (EMA) at 1.0684. Nevertheless, a mixed market sentiment capped the Euro{s (EUR) fall, even though US Treasury bond yields skyrocketed, underpinning the US Dollar (USD). As the Asian session begins, the EUR/USD trades at 1.0727, up 0.02%.

EUR/USD Price Analysis: Technical outlook

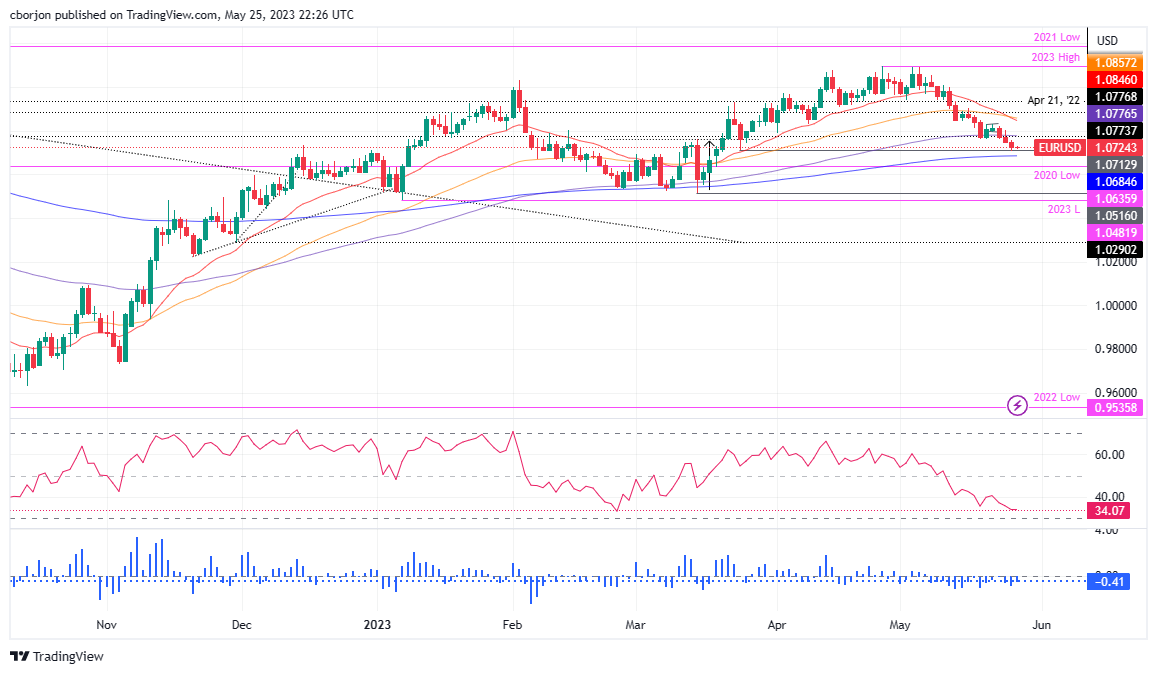
Two days ago, the EUR/USD slumped below the 100-day Exponential Moving Average (EMA) at 1.0776, with sellers taking advantage of it, as the EUR/USD registered three straight sessions of losses. Although the pair will likely print additional losses, sellers must reclaim the 1.0700. That would leave the pair exposed, and once the EUR/USD dives below the 200-day EMA, that would shift the pair bias downwards.

That said, the EUR/USD first support would be the 2020 yearly low of 1.0636, ahead of falling to 1.0600. Break below will expose the March 15 daily low of 1.0516 before dropping to the year-to-date (YTD) low of 1.0482.

Conversely, if EUR/USD stays afloat above 1.0700, the EUR/USD  could stage a comeback, initially to the 100-day EMA at 1.0776. A breach of the letter will expose 1.0800 before the EUR/USD threatens the confluence of technical indicators, like the 50 and 20-day EMAs, at around 1.0845-1.0857. Once the intersection gives way, 1.0900 is on the cards.

EUR/USD Price Action – Daily chart

EUR/USD Daily chart

EUR/USD

Overview
Today last price1.0725
Today Daily Change-0.0025
Today Daily Change %-0.23
Today daily open1.075
 
Trends
Daily SMA201.0916
Daily SMA501.09
Daily SMA1001.0813
Daily SMA2001.0476
 
Levels
Previous Daily High1.0801
Previous Daily Low1.0748
Previous Weekly High1.0904
Previous Weekly Low1.076
Previous Monthly High1.1095
Previous Monthly Low1.0788
Daily Fibonacci 38.2%1.0769
Daily Fibonacci 61.8%1.0781
Daily Pivot Point S11.0731
Daily Pivot Point S21.0713
Daily Pivot Point S31.0678
Daily Pivot Point R11.0784
Daily Pivot Point R21.0819
Daily Pivot Point R31.0837

Author

Christian Borjon Valencia

Christian Borjon began his career as a retail trader in 2010, mainly focused on technical analysis and strategies around it. He started as a swing trader, as he used to work in another industry unrelated to the financial markets.

More from Christian Borjon Valencia
Share:

Markets move fast. We move first.

Orange Juice Newsletter brings you expert driven insights - not headlines. Every day on your inbox.

By subscribing you agree to our Terms and conditions.

Editor's Picks

EUR/USD bounces toward 1.1750 as US Dollar loses strength

EUR/USD returned to the 1.1750 price zone in the American session on Friday, despite falling Wall Street, which indicates risk aversion. Trading conditions remain thin following the New Year holiday and ahead of the weekend, with the focus shifting to US employment and European data scheduled for next week.

GBP/USD nears 1.3500, holds within familiar levels

After testing 1.3400 on the last day of 2025, GBP/USD managed to stage a rebound. Nevertheless, the pair finds it difficult to gather momentum and trades with modest intraday gains at around 1.3490 as market participants remain in holiday mood.

Gold trims intraday gains, approaches $4,300

Gold retreated sharply from the $4,400  area and trades flat for the day in the $4,320 price zone. Choppy trading conditions exacerbated the intraday decline, although XAU/USD bearish case is out of the picture, considering growing expectations for a dovish Fed and persistent geopolitical tensions.

Cardano gains early New Year momentum, bulls target falling wedge breakout

Cardano kicks off the New Year on a positive note and is extending gains, trading above $0.36 at the time of writing on Friday. Improving on-chain and derivatives data point to growing bullish interest, while the technical outlook keeps an upside breakout in focus.

Economic outlook 2026-2027 in advanced countries: Solidity test

After a year marked by global economic resilience and ending on a note of optimism, 2026 looks promising and could be a year of solid economic performance. In our baseline scenario, we expect most of the supportive factors at work in 2025 to continue to play a role in 2026.

Crypto market outlook for 2026

Year 2025 was volatile, as crypto often is.  Among positive catalysts were favourable regulatory changes in the U.S., rise of Digital Asset Treasuries (DAT), adoption of AI and tokenization of Real-World-Assets (RWA).