EUR/USD Price Analysis: Sellers cheer three-week-old support break around 1.0850


  • EUR/USD remains pressured after breaking short-term key support.
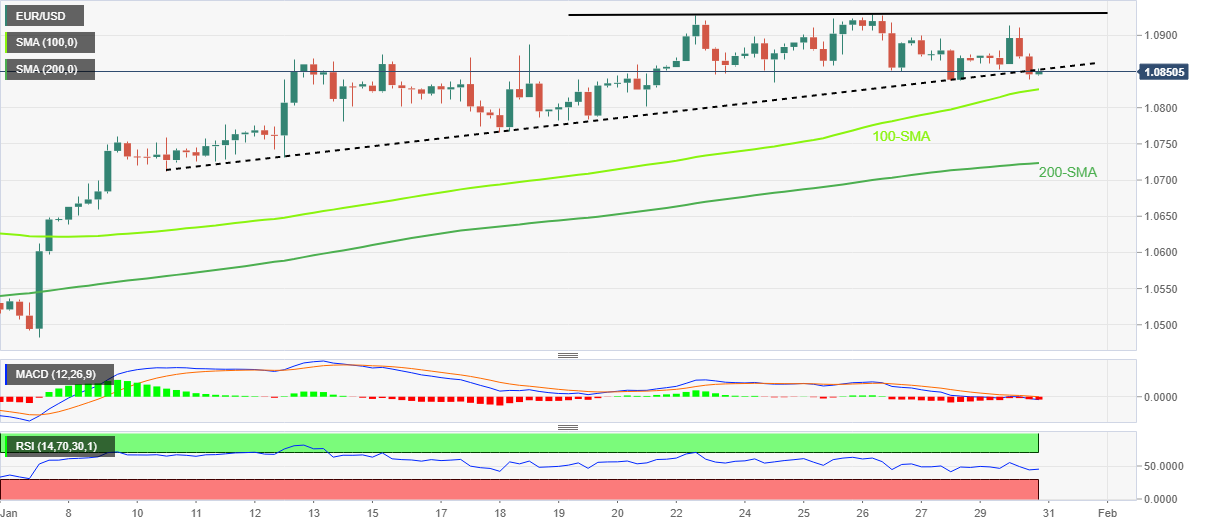
  • Bearish MACD signals, downbeat RSI adds strength to the downside bias targeting 100-SMA.
  • Double tops around 1.0930 also favor sellers to keep the reins.

EUR/USD seesaws around 1.0850 as bears take a breather after breaking important support. With this, the major currency pair confirms its place on the seller’s radar even if it probes the three-day downtrend with its latest inaction.

Not only the trend line breakdown but the bearish MACD signals and the downbeat RSI (14), not oversold, also keep the EUR/USD sellers hopeful. On the same line could be the double-top bearish formation marked around 1.0930.

As a result, the quote’s further downside towards the 100-bar Simple Moving Average (SMA), close to 1.0825 by the press time, appears imminent.

However, the 200-SMA and January 10 low, respectively near 1.0720 and 1.0710, could challenge the EUR/USD bears afterward.

In a case where the EUR/USD pair remains bearish past 1.0710, its slump toward the monthly low near 1.0480 can’t be ruled out.

Alternatively, recovery moves must cross the support-turned-resistance line from January 10, close to 1.0860 at the latest, to tease EUR/USD buyers.

Even so, the aforementioned double tops near 1.0930 will be a tough nut to crack for the pair bulls, a  break of which could quickly propel the price towards the 1.1000 round figure.

Should the EUR/USD pair remains firmer past 1.1000, its rally toward January 2022 low near 1.1120 can’t be ruled out.

EUR/USD: Four-hour chart

Trend: Further downside expected

Additional important levels

Overview
Today last price 1.0849
Today Daily Change -0.0016
Today Daily Change % -0.15%
Today daily open 1.0865
 
Trends
Daily SMA20 1.077
Daily SMA50 1.0624
Daily SMA100 1.0277
Daily SMA200 1.0312
 
Levels
Previous Daily High 1.09
Previous Daily Low 1.0838
Previous Weekly High 1.093
Previous Weekly Low 1.0835
Previous Monthly High 1.0736
Previous Monthly Low 1.0393
Daily Fibonacci 38.2% 1.0862
Daily Fibonacci 61.8% 1.0877
Daily Pivot Point S1 1.0835
Daily Pivot Point S2 1.0805
Daily Pivot Point S3 1.0773
Daily Pivot Point R1 1.0898
Daily Pivot Point R2 1.093
Daily Pivot Point R3 1.096


Share: Feed news

Information on these pages contains forward-looking statements that involve risks and uncertainties. Markets and instruments profiled on this page are for informational purposes only and should not in any way come across as a recommendation to buy or sell in these assets. You should do your own thorough research before making any investment decisions. FXStreet does not in any way guarantee that this information is free from mistakes, errors, or material misstatements. It also does not guarantee that this information is of a timely nature. Investing in Open Markets involves a great deal of risk, including the loss of all or a portion of your investment, as well as emotional distress. All risks, losses and costs associated with investing, including total loss of principal, are your responsibility. The views and opinions expressed in this article are those of the authors and do not necessarily reflect the official policy or position of FXStreet nor its advertisers. The author will not be held responsible for information that is found at the end of links posted on this page.

If not otherwise explicitly mentioned in the body of the article, at the time of writing, the author has no position in any stock mentioned in this article and no business relationship with any company mentioned. The author has not received compensation for writing this article, other than from FXStreet.

FXStreet and the author do not provide personalized recommendations. The author makes no representations as to the accuracy, completeness, or suitability of this information. FXStreet and the author will not be liable for any errors, omissions or any losses, injuries or damages arising from this information and its display or use. Errors and omissions excepted.

The author and FXStreet are not registered investment advisors and nothing in this article is intended to be investment advice.

Recommended content


Recommended content

Editors’ Picks

AUD/USD jumps above 0.6500 after hot Australian CPI data

AUD/USD jumps above 0.6500 after hot Australian CPI data

AUD/USD extended gains and recaptured 0.6500 in Asian trading, following the release of hotter-than-expected Australian inflation data. The Australian CPI rose 1% in QoQ in Q1 against 0.8% forecast, providing extra legs to the Australian Dollar upside. 

AUD/USD News

USD/JPY hangs near 34-year high at 154.88 as intervention risks loom

USD/JPY hangs near 34-year high at 154.88 as intervention risks loom

USD/JPY is sitting at a multi-decade high of 154.88 reached on Tuesday. Traders refrain from placing fresh bets on the pair as Japan's FX intervention risks loom. Broad US Dollar weakness also caps the upside in the major. US Durable Goods data are next on tap. 

USD/JPY News

Gold price cautious despite weaker US Dollar and falling US yields

Gold price cautious despite weaker US Dollar and falling US yields

Gold retreats modestly after failing to sustain gains despite fall in US Treasury yields, weaker US Dollar. XAU/USD struggles to capitalize following release of weaker-than-expected S&P Global PMIs, fueling speculation about potential Fed rate cuts.

Gold News

Crypto community reacts as BRICS considers launching stablecoin for international trade settlement

Crypto community reacts as BRICS considers launching stablecoin for international trade settlement

BRICS is intensifying efforts to reduce its reliance on the US dollar after plans for its stablecoin effort surfaced online on Tuesday. Most people expect the stablecoin to be backed by gold, considering BRICS nations have been accumulating large holdings of the commodity.

Read more

US versus the Eurozone: Inflation divergence causes monetary desynchronization

US versus the Eurozone: Inflation divergence causes monetary desynchronization

Historically there is a very close correlation between changes in US Treasury yields and German Bund yields. This is relevant at the current juncture, considering that the recent hawkish twist in the tone of the Fed might continue to push US long-term interest rates higher and put upward pressure on bond yields in the Eurozone.

Read more

Forex MAJORS

Cryptocurrencies

Signatures