EUR/USD Price Analysis: Rises to near 1.0810 followed by the barrier at 50-day EMA


  • EUR/USD could test the resistance zone around the 50-day EMA and a three-week high.
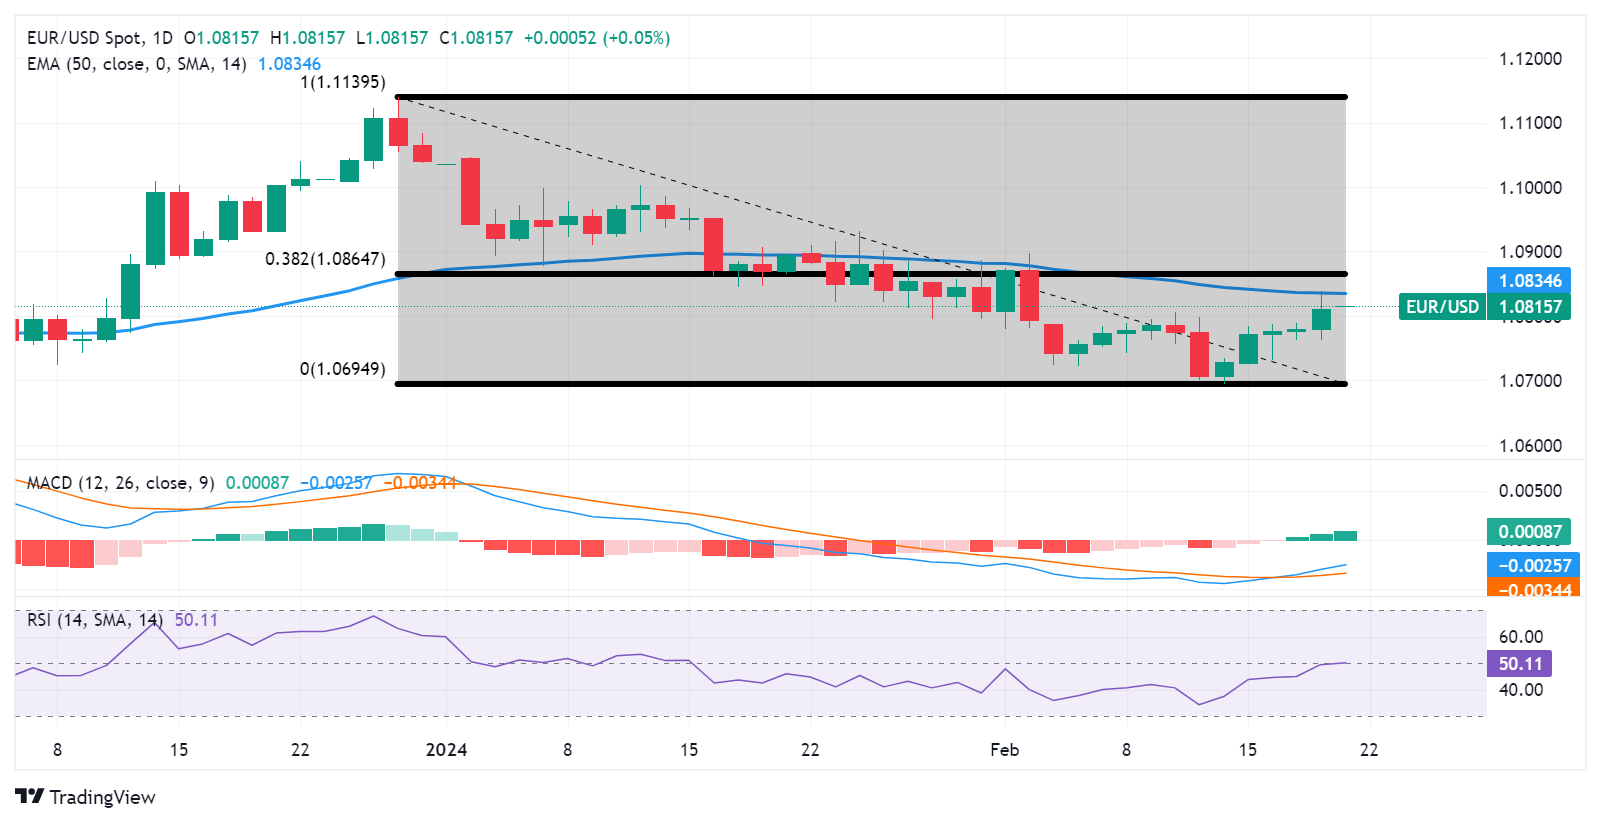
  • A break above the major level of 1.0850 could lead the pair to reach a 38.2% Fibonacci retracement at 1.0864.
  • Technical indicators suggest a momentum shift towards an upward direction.

EUR/USD continues its winning streak that began on February 14 as the US Dollar (USD) receives downward pressure, which in turn, underpins the EUR/USD pair. The pair edges higher around 1.0810 during the Asian session on Wednesday.

The EUR/USD pair could rise to test the immediate resistance zone around the 50-day Exponential Moving Average (EMA) at 1.0834 and the three-week high at 1.0838. A breakthrough above this zone could exert upward support for the pair to reach the major support at 1.0850 followed by the 38.2% Fibonacci retracement level at 1.0864.

The technical analysis of the EUR/USD pair indicates a potential shift towards upward momentum. While the 14-day Relative Strength Index (RSI) sits at the 50 mark, signaling a neutral stance, the Moving Average Convergence Divergence (MACD) lies below the centreline but shows a divergence above the signal line. Traders may await further confirmation from the MACD to determine a clear directional trend.

On the downside, the immediate support appears at the psychological level at 1.0800 followed by the recent low at 1.0761 recorded on Tuesday. A break below the latter could put downward pressure on the EUR/USD pair to navigate the major support level of 1.0750 with an aim to approach the psychological support at 1.0700.

EUR/USD: Daily Chart

EUR/USD: Other important levels to watch

Overview
Today last price 1.0816
Today Daily Change 0.0006
Today Daily Change % 0.06
Today daily open 1.081
 
Trends
Daily SMA20 1.0795
Daily SMA50 1.0891
Daily SMA100 1.0804
Daily SMA200 1.0827
 
Levels
Previous Daily High 1.0839
Previous Daily Low 1.0762
Previous Weekly High 1.0806
Previous Weekly Low 1.0695
Previous Monthly High 1.1046
Previous Monthly Low 1.0795
Daily Fibonacci 38.2% 1.0809
Daily Fibonacci 61.8% 1.0791
Daily Pivot Point S1 1.0769
Daily Pivot Point S2 1.0727
Daily Pivot Point S3 1.0692
Daily Pivot Point R1 1.0846
Daily Pivot Point R2 1.0881
Daily Pivot Point R3 1.0923


Share: Feed news

Information on these pages contains forward-looking statements that involve risks and uncertainties. Markets and instruments profiled on this page are for informational purposes only and should not in any way come across as a recommendation to buy or sell in these assets. You should do your own thorough research before making any investment decisions. FXStreet does not in any way guarantee that this information is free from mistakes, errors, or material misstatements. It also does not guarantee that this information is of a timely nature. Investing in Open Markets involves a great deal of risk, including the loss of all or a portion of your investment, as well as emotional distress. All risks, losses and costs associated with investing, including total loss of principal, are your responsibility. The views and opinions expressed in this article are those of the authors and do not necessarily reflect the official policy or position of FXStreet nor its advertisers. The author will not be held responsible for information that is found at the end of links posted on this page.

If not otherwise explicitly mentioned in the body of the article, at the time of writing, the author has no position in any stock mentioned in this article and no business relationship with any company mentioned. The author has not received compensation for writing this article, other than from FXStreet.

FXStreet and the author do not provide personalized recommendations. The author makes no representations as to the accuracy, completeness, or suitability of this information. FXStreet and the author will not be liable for any errors, omissions or any losses, injuries or damages arising from this information and its display or use. Errors and omissions excepted.

The author and FXStreet are not registered investment advisors and nothing in this article is intended to be investment advice.

Recommended content


Recommended content

Editors’ Picks

GBP/USD rises to near 1.2540, driven by higher UK GDP

GBP/USD rises to near 1.2540, driven by higher UK GDP

GBP/USD edged higher to near 1.2540 during Asian hours on Friday, buoyed by the release of higher-than-expected UK Gross Domestic Product (GDP) data for the first quarter.

GBP/USD News

EUR/USD: The crucial resistance level will emerge at the 1.0790–1.0800 region

EUR/USD: The crucial resistance level will emerge at the 1.0790–1.0800 region

The EUR/USD pair trades on a softer note near 1.0775 during the early European hours on Friday. The downtick of the major pair is supported by the renewed US Dollar demand amid hawkish comments from Federal Reserve officials. 

EUR/USD News

Gold price attracts some buyers despite hawkish Fedspeak

Gold price attracts some buyers despite hawkish Fedspeak

Gold price edges higher for the second consecutive day on Friday. Weak employment data bolstered the speculation that the weakening economy would force the Fed to cut rates.

Gold News

XRP tests support at $0.50 as Ripple joins alliance to work on blockchain recovery

XRP tests support at $0.50 as Ripple joins alliance to work on blockchain recovery

XRP trades around $0.5174 early on Friday, wiping out gains from earlier in the week, as Ripple announced it has joined an alliance to support digital asset recovery alongside Hedera and the Algorand Foundation. 

Read more

Rate cut optimism fuelled by higher US jobless claims

Rate cut optimism fuelled by higher US jobless claims

With Federal Reserve policy acting as the primary driver of investor sentiment in 2024, renewed optimism surrounding the possibility of rate cuts has propelled the Dow to its most significant rally since December. 

Read more

Forex MAJORS

Cryptocurrencies

Signatures