|

EUR/USD Price Analysis: Remains pressured towards 1.0630-15 support area

  • EUR/USD fades bounce off seven-week-old horizontal support, retreats from 61.8% Fibonacci retracement level.
  • RSI pullback favors the latest U-turn in Euro prices, suggesting further downside.
  • Convergence of 50-SMA, monthly resistance line challenges buyers.

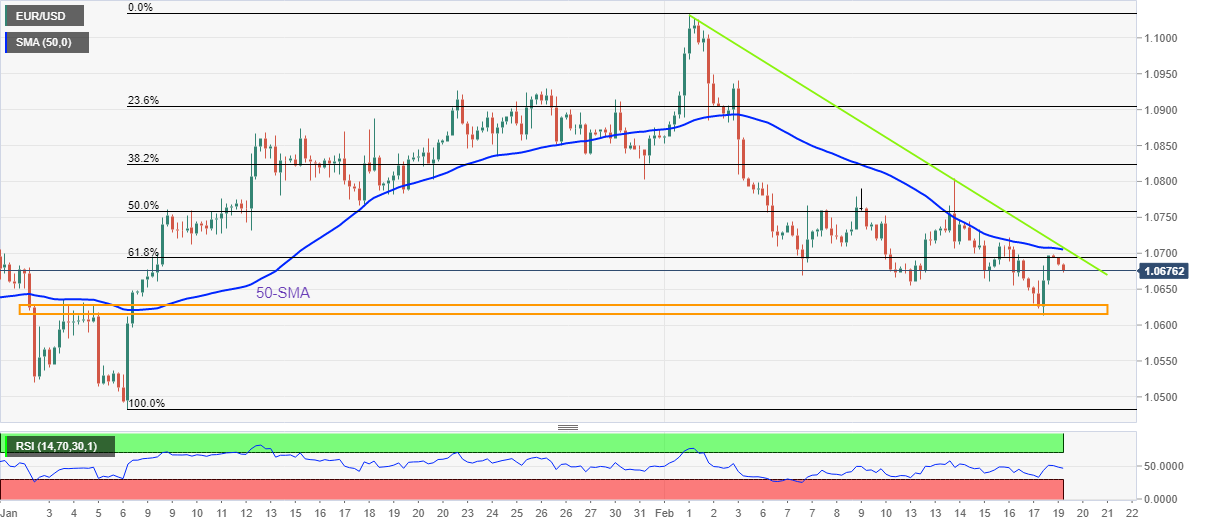
EUR/USD stays depressed around 1.0680-75 as it reverses the previous day’s corrective bounce during early Monday.

In doing so, the Euro pair retreats from the 61.8% Fibonacci retracement level of its January-February upside moves. The pullback also takes clues from the RSI’s (14) hesitance in rising further to favor sellers.

With this, the EUR/USD bears are all set to revisit the 1.0630-15 support area comprising multiple levels marked since early January 2023.

Following that, the 1.0600 and 1.0500 may entertain the EUR/USD sellers before directing them to the previous monthly low surrounding 1.0480. It should be noted that November’s top adds strength to the 1.0480 support.

Meanwhile, recovery moves may initially aim for the 61.8% Fibonacci retracement level surrounding 1.0700, also known as the golden Fibonacci retracement.

However, major attention will be given to a convergence of the 50-SMA and a downward-sloping resistance line from February 01, close to 1.0705-10.

In a case where EUR/USD remains firmer past 1.0710, the odds of witnessing a north-run towards the monthly high of 1.1033 can’t be ruled out.

That said, the previous weekly top of near 1.0800 acts as an extra filter to the north.

Overall, EUR/USD is likely to decline further, even as the downside room appears limited.

EUR/USD: Four-hour chart

Trend: Further downside expected

Additional important levels

Overview
Today last price1.068
Today Daily Change-0.0015
Today Daily Change %-0.14%
Today daily open1.0695
 
Trends
Daily SMA201.0797
Daily SMA501.0725
Daily SMA1001.0412
Daily SMA2001.0329
 
Levels
Previous Daily High1.0698
Previous Daily Low1.0613
Previous Weekly High1.0805
Previous Weekly Low1.0613
Previous Monthly High1.093
Previous Monthly Low1.0483
Daily Fibonacci 38.2%1.0666
Daily Fibonacci 61.8%1.0646
Daily Pivot Point S11.0639
Daily Pivot Point S21.0583
Daily Pivot Point S31.0553
Daily Pivot Point R11.0724
Daily Pivot Point R21.0754
Daily Pivot Point R31.081

Author

Anil Panchal

Anil Panchal

FXStreet

Anil Panchal has nearly 15 years of experience in tracking financial markets. With a keen interest in macroeconomics, Anil aptly tracks global news/updates and stays well-informed about the global financial moves and their implications.

More from Anil Panchal
Share:

Markets move fast. We move first.

Orange Juice Newsletter brings you expert driven insights - not headlines. Every day on your inbox.

By subscribing you agree to our Terms and conditions.

Editor's Picks

EUR/USD stays bid above 1.1700 as risk flows dominate

EUR/USD posts small gains above 1.1700 in early European trading hours on Monday. The US Dollar remains broadly subdued amid a risk-on market profile, underpinning the pair. 

GBP/USD clings to recovery gains near 1.3400

GBP/USD is clinging to recovery gains near 1.3400 in early Europe on Monday. The pair capitalizes on an upbeat market mood and a steady US Dollar as traders digest the recent

 monetary policy decisions by the Fed and the BoE.

Gold hits fresh record highs above $4,400 amid renewed geopolitical woes

Gold is hitting fresh record highs above $4,400 early Monday, helped by renewed geopolitical tensions. Israel-Iran conflict and US-Venezuela headlines drive investors toward the traditional store of value, Gold. 

Bitcoin, Ethereum and Ripple eye breakout for fresh recovery

Bitcoin, Ethereum, and Ripple are approaching key technical levels at the time of writing on Monday as the broader crypto market stabilizes. Market participants are closely watching whether BTC, ETH, and XRP can sustain breakouts and achieve decisive daily closes above nearby resistance levels, which could signal the start of a short-term recovery.

Ten questions that matter going into 2026

2026 may be less about a neat “base case” and more about a regime shift—the market can reprice what matters most (growth, inflation, fiscal, geopolitics, concentration). The biggest trap is false comfort: the same trades can look defensive… right up until they become crowded.

Hyperliquid price forecast: Bullish interest builds amid user recovery

Hyperliquid (HYPE) trades at $25 at press time on Monday, holding the 3% gains from the previous day. The perpetual exchange sees a recovery in active users, while weekly fees collected decline to the lowest level so far this month.