EUR/USD Price Analysis: Recovers some lost ground below the 1.0700 mark, all eyes on the Fed meeting


Share:
  • EUR/USD holds ground around 1.0675, gaining 0.16% on the day.
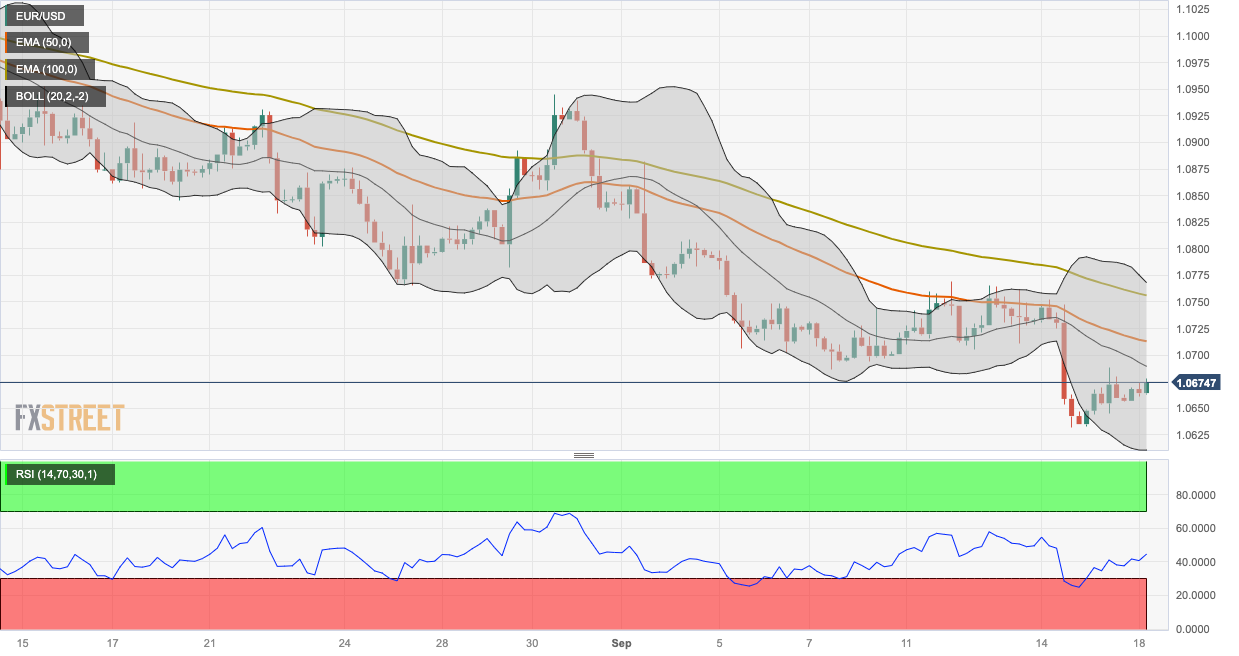
  • The major pair holds below the 50- and 100-day EMAs; Relative Strength Index (RSI) remains below 50.
  • The immediate resistance level appears at 1.0712; the key support level to watch is 1.0610.

The EUR/USD pair recovers from the recent losses and trades near 1.0675 during the early European trading hours on Monday. The upside of the major seems limited as investors await the Federal Reserve (Fed) interest rate decision on Wednesday.

The key US data indicated healthy economic conditions over the last week, which could support one more rate hike by the end of 2023. However, markets have priced in that the Fed would skip hiking rates in September, while odds for a 25 basis point (bps) hike at the November meeting decline to 27%, according to the CME Fedwatch tool.

According to the four-hour chart, the EUR/USD pair holds below the 50- and 100-day Exponential Moving Averages (EMAs), implying the path of least resistance for the EUR/USD is to the downside. Adding to this, the Relative Strength Index (RSI) remains in the bearish territory below 50, supporting EUR/USD sellers for now.

The immediate resistance level for EUR/USD appears at 1.0712 (the 50-hour EMA). Further north, the pair will challenge the next hurdle at 1.0755 (the 100-hour EMA). Any meaningful follow-through buying beyond the latter could pave the way to the next barrier near the upper boundary of the Bollinger Band at 1.0768 en route to a psychological round mark at 1.0800.

On the downside, the key support level to watch is 1.0610, representing the lower limit of the Bollinger Band. The additional downside stop is seen at 1.0538 (a low of February 27), followed by 1.0515 (a low of March 15).
 

EUR/USD four-hour chart


EUR/USD

Overview
Today last price 1.0676
Today Daily Change 0.0019
Today Daily Change % 0.18
Today daily open 1.0657
 
Trends
Daily SMA20 1.0782
Daily SMA50 1.093
Daily SMA100 1.0895
Daily SMA200 1.0828
 
Levels
Previous Daily High 1.0688
Previous Daily Low 1.0633
Previous Weekly High 1.0769
Previous Weekly Low 1.0632
Previous Monthly High 1.1065
Previous Monthly Low 1.0766
Daily Fibonacci 38.2% 1.0667
Daily Fibonacci 61.8% 1.0654
Daily Pivot Point S1 1.0631
Daily Pivot Point S2 1.0605
Daily Pivot Point S3 1.0576
Daily Pivot Point R1 1.0686
Daily Pivot Point R2 1.0714
Daily Pivot Point R3 1.074


Share: Feed news

Information on these pages contains forward-looking statements that involve risks and uncertainties. Markets and instruments profiled on this page are for informational purposes only and should not in any way come across as a recommendation to buy or sell in these assets. You should do your own thorough research before making any investment decisions. FXStreet does not in any way guarantee that this information is free from mistakes, errors, or material misstatements. It also does not guarantee that this information is of a timely nature. Investing in Open Markets involves a great deal of risk, including the loss of all or a portion of your investment, as well as emotional distress. All risks, losses and costs associated with investing, including total loss of principal, are your responsibility. The views and opinions expressed in this article are those of the authors and do not necessarily reflect the official policy or position of FXStreet nor its advertisers. The author will not be held responsible for information that is found at the end of links posted on this page.

If not otherwise explicitly mentioned in the body of the article, at the time of writing, the author has no position in any stock mentioned in this article and no business relationship with any company mentioned. The author has not received compensation for writing this article, other than from FXStreet.

FXStreet and the author do not provide personalized recommendations. The author makes no representations as to the accuracy, completeness, or suitability of this information. FXStreet and the author will not be liable for any errors, omissions or any losses, injuries or damages arising from this information and its display or use. Errors and omissions excepted.

The author and FXStreet are not registered investment advisors and nothing in this article is intended to be investment advice.

Follow us on Telegram

Stay updated of all the news

Join Telegram

Recommended content


Follow us on Telegram

Stay updated of all the news

Join Telegram

Recommended content

Editors’ Picks

EUR/USD loses traction, retreats below 1.0600

EUR/USD loses traction, retreats below 1.0600

EUR/USD lost its recovery momentum and declined below 1.0600 in the American session on Friday, erasing a portion of its daily gains in the process. Nevertheless, the risk-positive market atmosphere after PCE inflation data helps the pair limit its losses.

EUR/USD News

GBP/USD turns negative on the day below 1.2200

GBP/USD turns negative on the day below 1.2200

GBP/USD reversed its direction and slumped below 1.2200 in the American session on Friday after rising above 1.2270 earlier in the day. Position readjustments and profit-taking on the last trading day of the quarter seems to be weighing on Pound Sterling.

GBP/USD News

Gold reverses direction, drops below $1,860

Gold reverses direction, drops below $1,860

Following a steady rebound toward $1,880 on Friday, Gold price made a sharp U-turn and turned negative on the day near $1,860. Although the 10-year US T-bond yield is down more than 1%, XAU/USD struggles to find demand on the last day of Q3.

Gold News

DOT confirms trend reversal, eyes retest of $5 after reclaiming key hurdle

DOT confirms trend reversal, eyes retest of $5 after reclaiming key hurdle

Polkadot price seems to be ending its downtrend after shedding 92.91% in the last two years from its all-time high of $55.09. In the last three days, DOT has inflated by 3.3%, breaching a declining trendline and confirming the potential start of an uptrend.

Read more

Earnings beat triggers Nike to spike 9%

Earnings beat triggers Nike to spike 9%

Nike (NKE) stock has surged over 9% in Friday’s premarket, climbing above $98 per share, following late Thursday’s fiscal first-quarter earnings release. Nike beat pessimistic earnings expectations by more than 23% and hiked its dividend by 9%.

Read more

Forex MAJORS

Cryptocurrencies

Signatures