|

EUR/USD Price Analysis: Path of least resistance appears down ahead of Lagarde

  • EUR/USD wavers in a tight range below 1.1700-1.1730, Lagarde eyed.
  • German election wrangling and weaker US dollar leave the pair in limbo.
  • EUR/USD’s hourly chart shows that downside remains more compelling for now.

EUR/USD is attempting a tepid bounce from daily lows, but remains well within the trading range so far this Monday, as markets refrain from placing any fresh bets on the main currency pair after the German election outcome and ahead of the speech by the European Central Bank (ECB) Christine Lagarde.

Markets also await the US Durable Goods Orders data for fresh dollar trades, as the risk-on mood appears to keep the USD bulls at bay in early Europe. Receding China Evergrande fears combined with the US infrastructure stimulus optimism has lifted the investors’ sentiments starting out a big week, with Fed Chair Powell’s testimony and the US ISM Manufacturing Index – the key highlights.

Looking at EUR/USD’s one-hour chart, the price is teasing an ascending triangle breakdown, with an hourly candlestick closing below the rising trendline support at 1.1722 to validate the downside breakout.

A test of the 1.1700 mark will be inevitable on a triangle breakdown, opening floors for a retest of the multi-week lows near 1.1680.

The Relative Strength Index (RSI) is pointing south below the midline, backing the case for further downside.

EUR/USD: Hourly chart

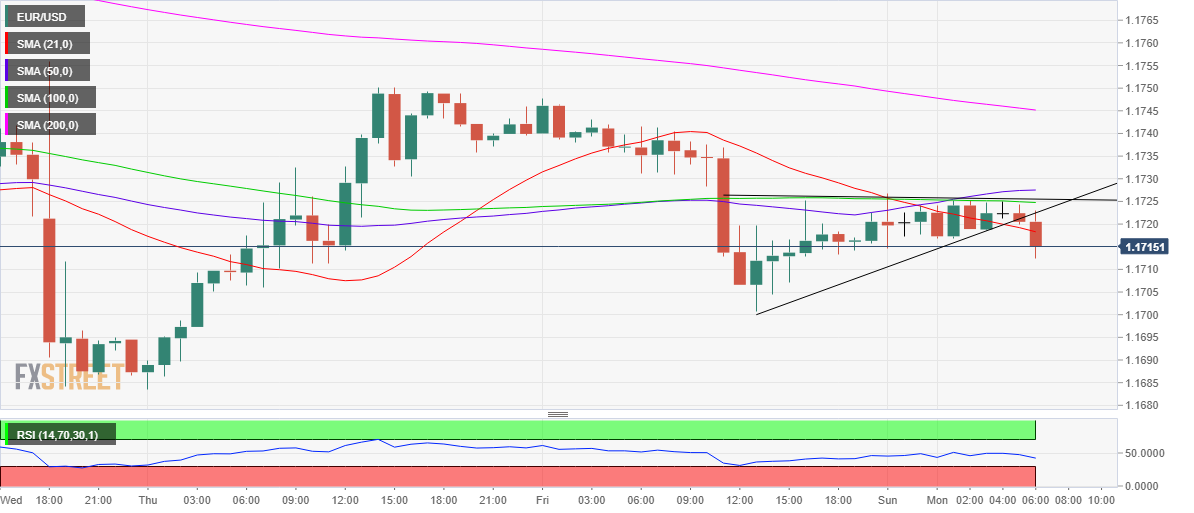
Alternatively, recapturing of the triangle support now resistance at 1.1722 is critical to attempting a minor pullback towards the horizontal 100-Hourly Moving Average (HMA) at 1.1726.

Further up, the mildly bullish 50-HMA at 1.1730 could be challenged by the bullish traders. The 1.1750 psychological level will come into play if the buying pressure intensifies.

EUR/USD: Additional levels to consider

EUR/USD

Overview
Today last price1.1714
Today Daily Change-0.0004
Today Daily Change %-0.03
Today daily open1.172
 
Trends
Daily SMA201.1795
Daily SMA501.1786
Daily SMA1001.191
Daily SMA2001.198
 
Levels
Previous Daily High1.1748
Previous Daily Low1.1701
Previous Weekly High1.1756
Previous Weekly Low1.1684
Previous Monthly High1.19
Previous Monthly Low1.1664
Daily Fibonacci 38.2%1.1719
Daily Fibonacci 61.8%1.173
Daily Pivot Point S11.1698
Daily Pivot Point S21.1676
Daily Pivot Point S31.1651
Daily Pivot Point R11.1745
Daily Pivot Point R21.177
Daily Pivot Point R31.1792

Author

Dhwani Mehta

Dhwani Mehta

FXStreet

Residing in Mumbai (India), Dhwani is a Senior Analyst and Manager of the Asian session at FXStreet. She has over 10 years of experience in analyzing and covering the global financial markets, with specialization in Forex and commodities markets.

More from Dhwani Mehta
Share:

Editor's Picks

EUR/USD rebounds from session lows, stays below 1.1650

EUR/USD is recovers modestly from session lows but remains in the red below 1.1650 in European trading on Thursday. The pair faces headwinds from a renewed uptick in the US Dollar amid a negative shift in risk sentiment. Surging energy prices due to the Middle East war keep the bearish pressure intact on the Euro. The US Jobless Claims data are next of note. 

GBP/USD stays weak near 1.3350 amid UK stagflation risks

GBP/USD sticks to losses near 1.3350 in the European session on Thursday. The Pound Sterling loses ground amid fears that the United Kingdom economy could face stagflation risks due to higher energy prices, while the US Dollar attracts fresh havem demand ahead of the US Jobless Claims data. 

Gold climbs near $5,200 as Iran war fuels safe-haven demand

Gold price extends its gains for the second successive session on Thursday as traders seek safety amid the ongoing war in the Middle East. US and Israeli strikes across Iranian territory and widespread Iranian missile and drone retaliation across the Middle East, including attacks on regional targets and military sites, prolong the crisis and its impact.

Three reasons to be bearish on Bitcoin

Bitcoin is holding up well taking into account the uncertainty stemming from the Middle East. Despite this week’s rally, the long-term outlook remains bearish. Here are three reasons why I think the storm for the largest cryptocurrency isn't over yet.

Markets attempt to rally on positive news from Iran

There’s been an abrupt change in sentiment this morning, European stock markets are higher and oil and gas prices are moderating, after comments from Iran’s deputy minister about pre-conflict talks between Iran and the US.

Cardano Price Analysis: Approaches key trendline amid bearish sentiment

Cardano (ADA) price is approaching its descending trendline around $0.28 at the time of writing, set to shape the next directional move. The derivatives metrics paint a bearish picture, with ADA’s Open Interest continuing to fall and short bets rising among traders.