|

EUR/USD Price Analysis: Reverses recent gains to near 1.0680, Eurozone final CPI eyed

  • EUR/USD retraces two-day gains due to market caution before the Fed decision.
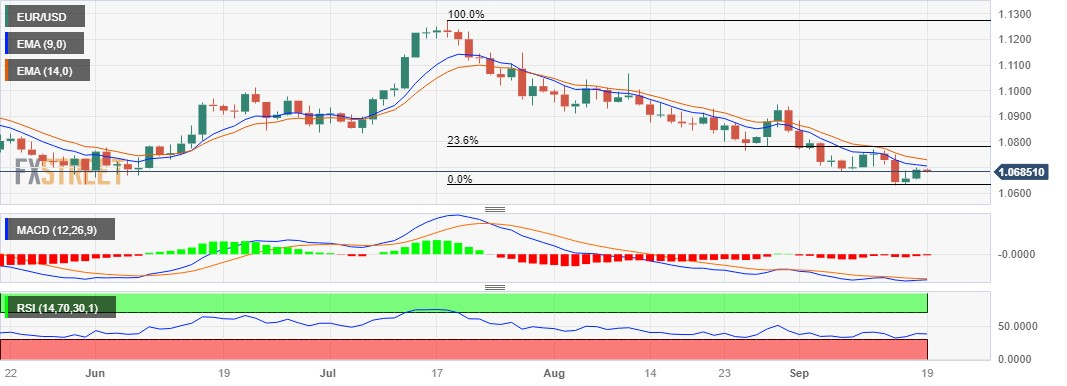
  • MACD shows a pattern of convergence below the signal line; suggesting a reversal in momentum.
  • The immediate support appears around 1.0650 psychological level aligned with the previous week’s low.

EUR/USD snaps the two-day winning streak, trading lower around 1.0680 during the Asian session on Tuesday. The pair is facing downward pressure due to the market caution ahead of the US Federal Reserve’s (Fed) policy decision.

The data of the Harmonized Index of Consumer Prices (HICP) and Core HICP from the Eurozone is likely to be released later in the day. Investors will observe these datasets, seeking further impetus on the economic situation in the bloc.

The immediate support for the EUR/USD pair appears around the 1.0650 psychological level, followed by the previous week’s low at 1.0631.

If bearish sentiment exerts pressure, the pair could potentially approach the next support level near the 1.0600 psychological level.

On the upside, the EUR/USD pair could face a barrier around the 1.0700 psychological level, lined up with the nine-day Exponential Moving Average (EMA) at 1.0705.

A firm break above the latter could lead the bulls to explore the region around the 14-day EMA at 1.0730, following the 23.6% Fibonacci retracement at 1.0783 level.

The Moving Average Convergence Divergence (MACD) line remains below the centerline, but it exhibits a pattern of convergence beneath the signal line. This pattern implies the potential for a reversal in momentum, indicating that the recent downtrend may be losing strength.

However, traders of the EUR/USD pair will likely observe the 14-day Relative Strength Index (RSI), which indicates bearish momentum in the short term as it lies below the 50 level.

EUR/USD: Daily Chart
EUR/USD: additional important levels

Overview
Today last price1.0684
Today Daily Change-0.0008
Today Daily Change %-0.07
Today daily open1.0692
 
Trends
Daily SMA201.0771
Daily SMA501.0924
Daily SMA1001.0892
Daily SMA2001.0829
 
Levels
Previous Daily High1.0699
Previous Daily Low1.0655
Previous Weekly High1.0769
Previous Weekly Low1.0632
Previous Monthly High1.1065
Previous Monthly Low1.0766
Daily Fibonacci 38.2%1.0682
Daily Fibonacci 61.8%1.0672
Daily Pivot Point S11.0665
Daily Pivot Point S21.0638
Daily Pivot Point S31.0621
Daily Pivot Point R11.0709
Daily Pivot Point R21.0726
Daily Pivot Point R31.0753

Author

Akhtar Faruqui

Akhtar Faruqui is a Forex Analyst based in New Delhi, India. With a keen eye for market trends and a passion for dissecting complex financial dynamics, he is dedicated to delivering accurate and insightful Forex news and analysis.


More from Akhtar Faruqui
Share:

Editor's Picks

AUD/USD remains below 0.7000 amid light trading

AUD/USD fills a modest bearish gap on Monday, but remains below 0.7000 in the Asian session amid holiday-thinned liquidity. The US Dollar attempts a bounce even as US bond yields pull back from multi-year highs, limiting the pair. Moreover, diminishing odds of another RBA rate hike in November cap the Aussie.

USD/JPY hovers above 158.00 amid Japan/ US holiday

USD/JPY extends its range-bound price action into a new week, trading above 158.00 as bulls remain on high alert amid speculation that authorities will step in to prop up the Japanese Yen. Meanwhile, softer US bond yields keep US Dollar bulls on the back foot and cap the pair's upside. However, geopolitical uncertainties could limit losses for the safe-haven buck amid thin liquidity due to a holiday in Japan and the US.

Gold sticks to modest losses; seems vulnerable below $4,200 on Fed hike bets

Gold extends its intraday retracement slide from a one-week high, hitting a fresh daily low around $4,170 during the early European session. The US Dollar attracts fresh buyers after a modest downtick amid the US Federal Reserve's hawkish outlook, which, in turn, is seen as weighing on the non-yielding bullion.

Pi Network Price Forecast: PI defends $0.0800 support as selling pressure mounts

Pi Network is trading in the red on Monday, hovering above $0.0800 as selling pressure mounts. PI token’s speculative demand is easing, with Open Interest below $9 million despite rising social chatter, hinting at panic-driven buzz among investors. The technical outlook for PI suggests a bearish bias, with the risk of breaking below the $0.0800 support level.

USD/INR: Deep in red below 96.00 as RBI rescues Indian Rupee

After opening significantly higher against the US Dollar (USD) on Monday, the Indian Rupee (INR) clings to recovery gains near 95.80. The pair remains undermined by the Reserve Bank of India’s (RBI) fresh measures to curb US Dollar demand, which has brought relief for the Indian currency.

Has Bitcoin really escaped the macro forces it was built to fight?
Over 17 years ago, Satoshi Nakamoto designed Bitcoin (BTC) on the back of a global financial crisis as an alternative to the global monetary system outside the control of central banks, governments and traditional intermediaries. This raises a key question: has Bitcoin really become independent of the macroeconomic forces it was built to challenge?















