EUR/USD Price Analysis: Off two-week highs, but pullback could be short-lived


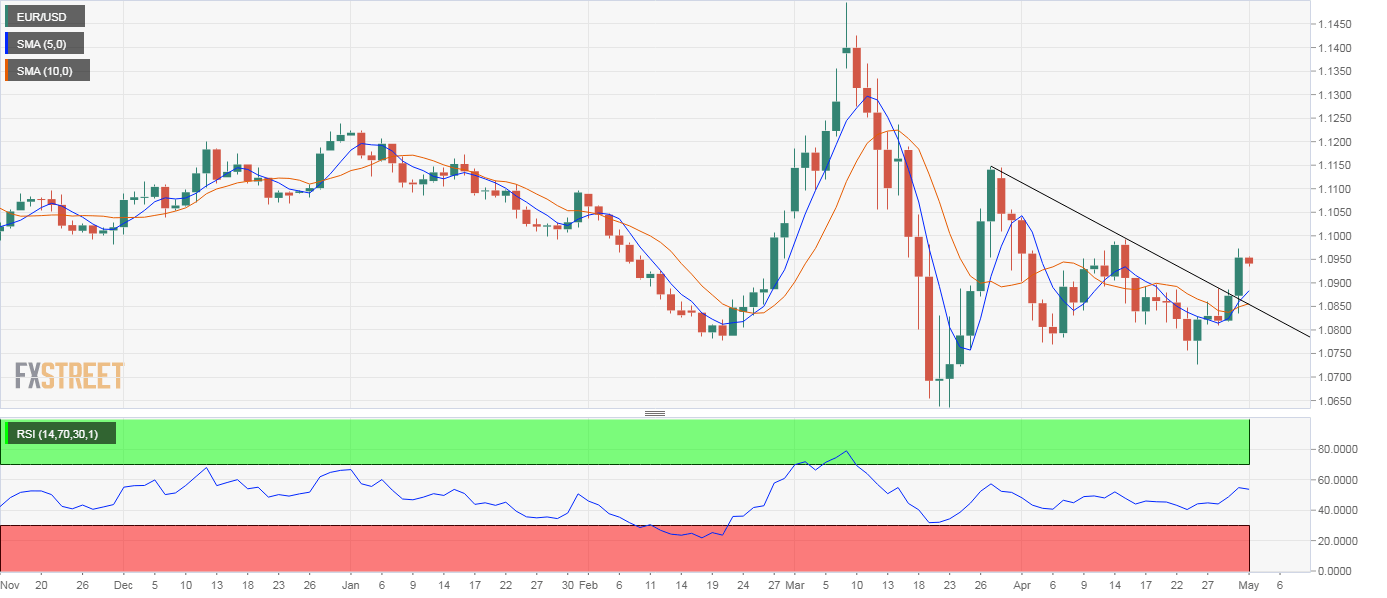
  • EUR/USD's daily chart shows an upside break of a descending trendline. 
  • Indicators look to have rolled over in favor of the bulls. 

EUR/USD is trading in the red near 1.0940 at press time, having printed a two-week high of 1.0973 during Thursday's American trading hours. 

The pullback, however, may be reversed, as the daily chart is reporting bearish conditions. To start with, Thursday's candle confirmed a convincing breakout above the trendline falling from March 27 and April 15 highs. 

The 5- and 10-day averages are beginning to trend north, a sign the upward momentum is about to gather pace. Further, the 14-day relative strength index has crossed into bullish territory above 50 for the first time in four weeks. 

The path of least resistance appears to be on the higher side. The immediate resistance is located at 1.10 (100-day MA) and 1.1034 (200-day MA). Meanwhile, on the lower side, Thursday's low of 1.0833 is the level to beat for the bears. 

Daily chart

Trend: Bullish

Technical levels

EUR/USD

Overview
Today last price 1.0939
Today Daily Change -0.0015
Today Daily Change % -0.14
Today daily open 1.0954
 
Trends
Daily SMA20 1.0867
Daily SMA50 1.0961
Daily SMA100 1.1008
Daily SMA200 1.1037
 
Levels
Previous Daily High 1.0973
Previous Daily Low 1.0835
Previous Weekly High 1.0897
Previous Weekly Low 1.0727
Previous Monthly High 1.1039
Previous Monthly Low 1.0727
Daily Fibonacci 38.2% 1.092
Daily Fibonacci 61.8% 1.0888
Daily Pivot Point S1 1.0868
Daily Pivot Point S2 1.0783
Daily Pivot Point S3 1.073
Daily Pivot Point R1 1.1006
Daily Pivot Point R2 1.1059
Daily Pivot Point R3 1.1144


Share: Feed news

Information on these pages contains forward-looking statements that involve risks and uncertainties. Markets and instruments profiled on this page are for informational purposes only and should not in any way come across as a recommendation to buy or sell in these assets. You should do your own thorough research before making any investment decisions. FXStreet does not in any way guarantee that this information is free from mistakes, errors, or material misstatements. It also does not guarantee that this information is of a timely nature. Investing in Open Markets involves a great deal of risk, including the loss of all or a portion of your investment, as well as emotional distress. All risks, losses and costs associated with investing, including total loss of principal, are your responsibility. The views and opinions expressed in this article are those of the authors and do not necessarily reflect the official policy or position of FXStreet nor its advertisers. The author will not be held responsible for information that is found at the end of links posted on this page.

If not otherwise explicitly mentioned in the body of the article, at the time of writing, the author has no position in any stock mentioned in this article and no business relationship with any company mentioned. The author has not received compensation for writing this article, other than from FXStreet.

FXStreet and the author do not provide personalized recommendations. The author makes no representations as to the accuracy, completeness, or suitability of this information. FXStreet and the author will not be liable for any errors, omissions or any losses, injuries or damages arising from this information and its display or use. Errors and omissions excepted.

The author and FXStreet are not registered investment advisors and nothing in this article is intended to be investment advice.

Recommended content


Recommended content

Editors’ Picks

AUD/USD posts gain, yet dive below 0.6500 amid Aussie CPI, ahead of US GDP

AUD/USD posts gain, yet dive below 0.6500 amid Aussie CPI, ahead of US GDP

The Aussie Dollar finished Wednesday’s session with decent gains of 0.15% against the US Dollar, yet it retreated from weekly highs of 0.6529, which it hit after a hotter-than-expected inflation report. As the Asian session begins, the AUD/USD trades around 0.6495.

AUD/USD News

USD/JPY finds its highest bids since 1990, approaches 156.00

USD/JPY finds its highest bids since 1990, approaches 156.00

USD/JPY broke into its highest chart territory since June of 1990 on Wednesday, peaking near 155.40 for the first time in 34 years as the Japanese Yen continues to tumble across the broad FX market. 

USD/JPY News

Gold stays firm amid higher US yields as traders await US GDP data

Gold stays firm amid higher US yields as traders await US GDP data

Gold recovers from recent losses, buoyed by market interest despite a stronger US Dollar and higher US Treasury yields. De-escalation of Middle East tensions contributed to increased market stability, denting the appetite for Gold buying.

Gold News

Ethereum suffers slight pullback, Hong Kong spot ETH ETFs to begin trading on April 30

Ethereum suffers slight pullback, Hong Kong spot ETH ETFs to begin trading on April 30

Ethereum suffered a brief decline on Wednesday afternoon despite increased accumulation from whales. This follows Ethereum restaking protocol Renzo restaked ETH crashing from its 1:1 peg with ETH and increased activities surrounding spot Ethereum ETFs.

Read more

Dow Jones Industrial Average hesitates on Wednesday as markets wait for key US data

Dow Jones Industrial Average hesitates on Wednesday as markets wait for key US data

The DJIA stumbled on Wednesday, falling from recent highs near 38,550.00 as investors ease off of Tuesday’s risk appetite. The index recovered as US data continues to vex financial markets that remain overwhelmingly focused on rate cuts from the US Fed.

Read more

Forex MAJORS

Cryptocurrencies

Signatures