EUR/USD Price Analysis: Off 100-SMA inside weekly triangle


  • EUR/USD seesaws inside a 10-pips trading range after bouncing off 1.2164.
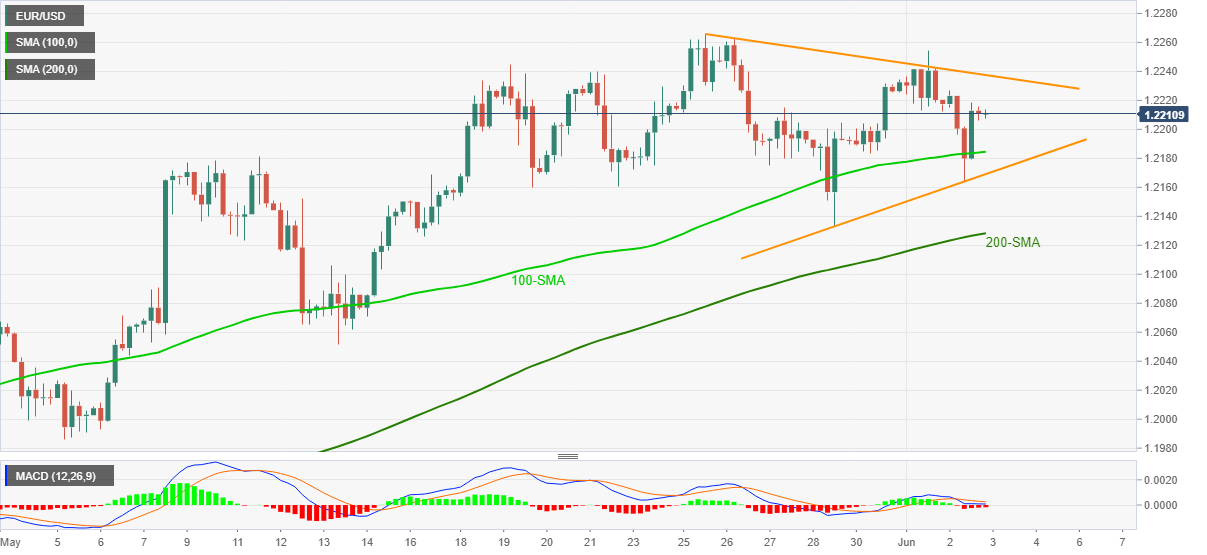
  • Sluggish MACD and a symmetrical triangle suggest further subdued trading.
  • 200-SMA adds to the downside support, offering a tailwind to bulls.

EUR/USD wobbles in the middle of the 1.2106–2116 trading range amid a quiet Asian morning on Thursday. In doing so, the currency major pair keeps its bounce off 100-SMA while staying inside a one-week-old symmetrical triangle.

Given the sluggish MACD and a chart pattern suggesting sideways grind, EUR/USD may remain between 1.2170 and 1.2240 area comprising the triangle’s lower and upper line respectively. However, sustained trading beyond the key SMA favors the quote’s underlying bullish momentum.

Hence, buyers could initiate long positions on the successful break of 1.2240, with the initial target of May’s high near 1.2265 before aiming the 1.2300 and the yearly peak surrounding 1.2350.

On the contrary, sellers will not only need a downside break of 1.2170 but also a clear breakdown beneath the 200-SMA level of 1.2128 to regain the controls.

Following that, the mid-May low of 1.2051 and the 1.2000 threshold will gain the market’s attention.

EUR/USD four-hour chart

Trend: Sideways

Additional important levels

Overview
Today last price 1.2212
Today Daily Change -1 pip
Today Daily Change % -0.01%
Today daily open 1.2213
 
Trends
Daily SMA20 1.2163
Daily SMA50 1.2026
Daily SMA100 1.204
Daily SMA200 1.198
 
Levels
Previous Daily High 1.2254
Previous Daily Low 1.2212
Previous Weekly High 1.2266
Previous Weekly Low 1.2133
Previous Monthly High 1.2266
Previous Monthly Low 1.1986
Daily Fibonacci 38.2% 1.2228
Daily Fibonacci 61.8% 1.2238
Daily Pivot Point S1 1.2199
Daily Pivot Point S2 1.2184
Daily Pivot Point S3 1.2156
Daily Pivot Point R1 1.2241
Daily Pivot Point R2 1.2269
Daily Pivot Point R3 1.2284


Share: Feed news

Information on these pages contains forward-looking statements that involve risks and uncertainties. Markets and instruments profiled on this page are for informational purposes only and should not in any way come across as a recommendation to buy or sell in these assets. You should do your own thorough research before making any investment decisions. FXStreet does not in any way guarantee that this information is free from mistakes, errors, or material misstatements. It also does not guarantee that this information is of a timely nature. Investing in Open Markets involves a great deal of risk, including the loss of all or a portion of your investment, as well as emotional distress. All risks, losses and costs associated with investing, including total loss of principal, are your responsibility. The views and opinions expressed in this article are those of the authors and do not necessarily reflect the official policy or position of FXStreet nor its advertisers. The author will not be held responsible for information that is found at the end of links posted on this page.

If not otherwise explicitly mentioned in the body of the article, at the time of writing, the author has no position in any stock mentioned in this article and no business relationship with any company mentioned. The author has not received compensation for writing this article, other than from FXStreet.

FXStreet and the author do not provide personalized recommendations. The author makes no representations as to the accuracy, completeness, or suitability of this information. FXStreet and the author will not be liable for any errors, omissions or any losses, injuries or damages arising from this information and its display or use. Errors and omissions excepted.

The author and FXStreet are not registered investment advisors and nothing in this article is intended to be investment advice.

Recommended content


Recommended content

Editors’ Picks

USD/JPY jumps above 156.00 on BoJ's steady policy

USD/JPY jumps above 156.00 on BoJ's steady policy

USD/JPY has come under intense buying pressure, surging past 156.00 after the Bank of Japan kept the key rate unchanged but tweaked its policy statement. The BoJ maintained its fiscal year 2024 and 2025 inflation forecast, disappointing the Japanese Yen buyers. 

USD/JPY News

AUD/USD consolidates gains above 0.6500 after Australian PPI data

AUD/USD consolidates gains above 0.6500 after Australian PPI data

AUD/USD is consolidating gains above 0.6500 in Asian trading on Friday. The pair capitalizes on an annual increase in Australian PPI data. Meanwhile, a softer US Dollar and improving market mood also underpin the Aussie ahead of the US PCE inflation data. 

AUD/USD News

Gold price keeps its range around $2,330, awaits US PCE data

Gold price keeps its range around $2,330, awaits US PCE data

Gold price is consolidating Thursday's rebound early Friday. Gold price jumped after US GDP figures for the first quarter of 2024 missed estimates, increasing speculation that the Fed could lower borrowing costs. Focus shifts to US PCE inflation on Friday. 

Gold News

Stripe looks to bring back crypto payments as stablecoin market cap hits all-time high

Stripe looks to bring back crypto payments as stablecoin market cap hits all-time high

Stripe announced on Thursday that it would add support for USDC stablecoin, as the stablecoin market exploded in March, according to reports by Cryptocompare.

Read more

US economy: Slower growth with stronger inflation

US economy: Slower growth with stronger inflation

The US Dollar strengthened, and stocks fell after statistical data from the US. The focus was on the preliminary estimate of GDP for the first quarter. Annualised quarterly growth came in at just 1.6%, down from the 2.5% and 3.4% previously forecast.

Read more

Forex MAJORS

Cryptocurrencies

Signatures