|

EUR/USD Price Analysis: Moves upward toward 1.0700 ahead of Eurozone PMI

  • EUR/USD continues the winning streak ahead of the Eurozone PMI.
  • MACD indicates a shift in momentum towards a bullish trend.
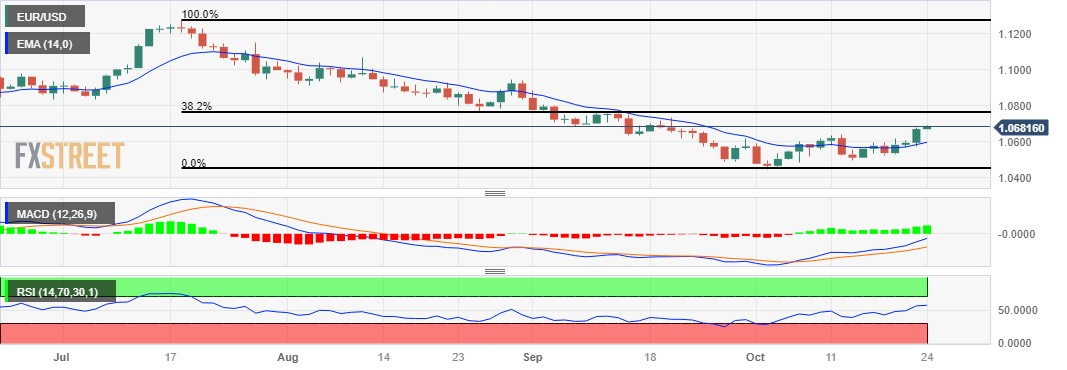
  • The major level at 1.0700 emerges as the key resistance following the 38.2% Fibonacci retracement.

EUR/USD continues to move upward for the fourth successive day, trading higher around the 1.0680 level during the Asian session on Tuesday. The pair receives upward support on the decline in the US Dollar (USD), coupled with an improved risk sentiment amid geopolitical tensions in the Middle East.

Market participants await the preliminary Eurozone October PMI. In Germany, both the German GfK Consumer Confidence Survey and PMI data are also on the agenda. Tuesday will feature a speech by ECB President Christine Lagarde. Looking ahead to Thursday, the ECB has its scheduled monetary policy meeting, and there's no anticipation of a change in interest rates.

The major level at 1.0700 emerges as the key resistance. A break above the latter could open the doors for the EUR/USD pair to explore the region around the 1.0750 psychological level, followed by the 38.2% Fibonacci retracement at 1.0764.

On the downside, the EUR/USD pair could meet the support at 1.0600 lined up with the 14-day Exponential Moving Average (EMA) at 1.0596.

The Moving Average Convergence Divergence (MACD) line lies below the centerline, signaling that the short-term average is beneath the long-term average. However, an interesting development is apparent as the line diverges above the signal line, hinting at a potential shift in momentum towards a bullish trend.

The EUR/USD pair implies a bullish momentum, as emphasized by a stronger bias revealed in the 14-day Relative Strength Index (RSI) holding above the 50 level.

EUR/USD: Daily Chart
EUR/USD: additional levels to watch

Overview
Today last price1.068
Today Daily Change0.0010
Today Daily Change %0.09
Today daily open1.067
 
Trends
Daily SMA201.0557
Daily SMA501.0685
Daily SMA1001.0825
Daily SMA2001.0819
 
Levels
Previous Daily High1.0678
Previous Daily Low1.0572
Previous Weekly High1.0617
Previous Weekly Low1.0511
Previous Monthly High1.0882
Previous Monthly Low1.0488
Daily Fibonacci 38.2%1.0637
Daily Fibonacci 61.8%1.0612
Daily Pivot Point S11.0602
Daily Pivot Point S21.0533
Daily Pivot Point S31.0495
Daily Pivot Point R11.0708
Daily Pivot Point R21.0746
Daily Pivot Point R31.0815

(This story was corrected on October 24 at 07:12 GMT to say that the EUR/USD pair was supported by the US Dollar decline, not challenged by it.)

Author

Akhtar Faruqui

Akhtar Faruqui is a Forex Analyst based in New Delhi, India. With a keen eye for market trends and a passion for dissecting complex financial dynamics, he is dedicated to delivering accurate and insightful Forex news and analysis.


More from Akhtar Faruqui
Share:

Editor's Picks

GBP/USD revisits 1.3530; Dollar pushes harder

GBP/USD adds to the weekly correction and recedes toward the 1.3530 zone on Friday. Indeed, Cable faces increasing selling pressure on the back of extra gains in the Greenback, particularly fuelled by Chair Warsh’s speech at the Jackson Hole Symposium and the US NFP Annual Revision (-79K).

EUR/USD breaches below 1.1600, multi-day lows

EUR/USD now accelerates its decline and retreats to seven-day troughs in the sub-1.1600 region at the end of the week. The pair’s pullback comes on the back of the strong rebound in the US Dollar after Chair Warsh delivered a hawkish message in Jackson Hole, while the US NFP Annual Revision came in at -79K.

Gold challenges its 200-day SMA near $4,530

Gold’s decline gathers fresh steam, hitting weekly lows while disputing its critical 200-day SMA near $4,530 per troy ounce. The yellow metal’s increasing weakness comes in response to the generalised upbeat tone in the US Dollar and the widespread rebound in US Treasury yields, as investors continue to reprice a Fed rate hike in September.

Week ahead: RBNZ and BoC decide on rates ahead of all-important US NFP
The US dollar staged a modest recovery this week, perhaps as traders decided to cover some of their short positions amid slightly stickier or in-line US PCE inflation numbers for July, confounding expectations of softer prints amid the softness revealed in the CPI data for the month.
CFTC Report: CAD short covering leads; Gold buying surges
The week in one sentence: speculative positioning shifted more constructively in the week to August 25. CAD short covering led the move, followed by a broad reduction in EUR shorts and renewed Gold buying. GBP and VIX positioning also improved, while JPY positioning deteriorated and WTI flows diverged from weaker prices.
Diesel’s record $100 warning: The oil shock hiding in plain sight

The Oil market may look calmer than it did a few months ago, but diesel is sending a very different message. The US diesel crack spread, the premium of ultra-low sulphur diesel futures over WTI, recently surged above $100 per barrel for the first time, reaching an intraday record of just over $102.00.