|

EUR/USD Price Analysis: Looks set for a breakdown below 1.0540

  • EUR/USD has turned sideways as investors await US Durable Goods Orders data for fresh impetus.
  • Rising wage offerings by US firms to acquire talent in a tight labor market has propelled households’ spending.
  • A range shift move by the RSI (14) indicates that the downside momentum has been triggered.

The EUR/USD pair is displaying a lackluster performance around 1.0550 in the Asian session. The volatility in the major currency pair has squeezed after a sheer downside inspired by the surprise jump in the United States consumer spending data released on Friday.

Rising wage offerings by the US firms to acquire talent in a tight labor market have propelled households’ spending. This has triggered fears of a continuation of the policy tightening spree by the Federal Reserve (Fed). The US Dollar Index (DXY) is demonstrating a subdued performance around 104.80 and is awaiting the release of the US Durable Goods Orders data for fresh cues.

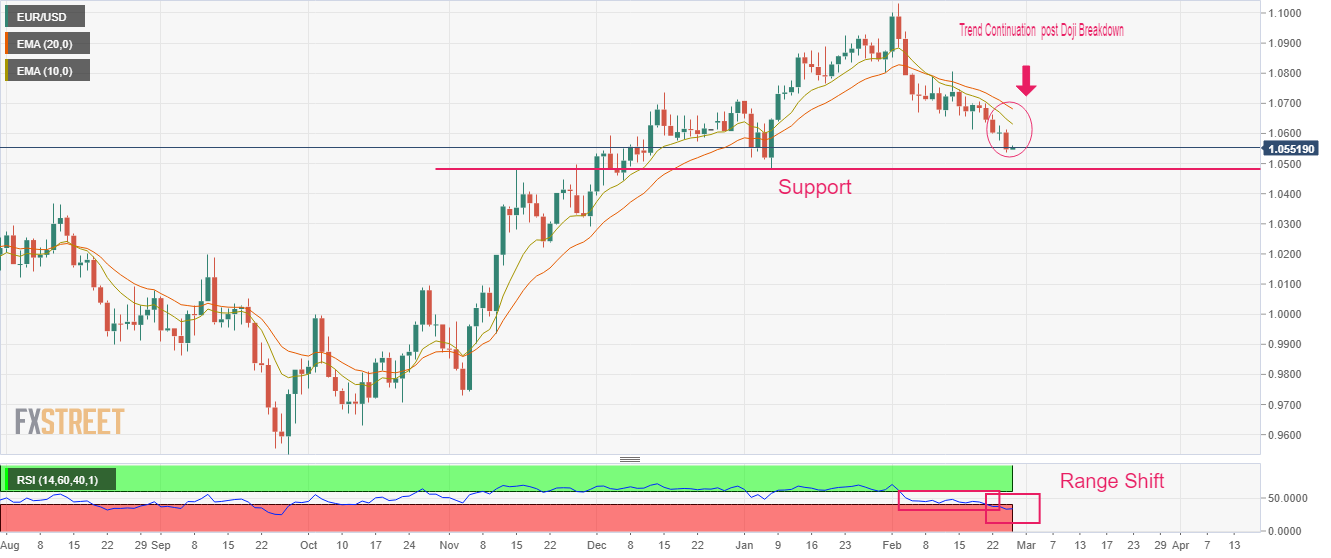
Thursday’s Doji formation was confidently broken by the market participants, which resulted in a trend continuation toward the downside. The Euro bulls are expected to find a cushion around the horizontal support plotted from 15 November 2022 high around 1.0482.

Downward-sloping 10-and 20-period Exponential Moving Averages (EMAs) at 1.0631 and 1.0381 respectively, adds to the downside filters.

The Relative Strength Index (RSI) (14) has displayed a range shift move from the 40.00-60.00 range to the bearish range of 20.00-40.00, which indicates that the downside momentum has been triggered.

For further downside, a breakdown of February 24 low at 1.0536 will drag the asset towards 15 November 2022 high around 1.0482 followed by 16 November 2022 high at 1.0439.

On the flip side, a recovery move above the round-level resistance at 1.06000 will drive the asset toward February 22 high at 1.0658. A break above February 22 high will expose the asset to February 20 high around 1.0700.

EUR/USD daily chart

.

EUR/USD

Overview
Today last price1.0553
Today Daily Change0.0006
Today Daily Change %0.06
Today daily open1.0547
 
Trends
Daily SMA201.073
Daily SMA501.0726
Daily SMA1001.0451
Daily SMA2001.0331
 
Levels
Previous Daily High1.0614
Previous Daily Low1.0536
Previous Weekly High1.0705
Previous Weekly Low1.0536
Previous Monthly High1.093
Previous Monthly Low1.0483
Daily Fibonacci 38.2%1.0566
Daily Fibonacci 61.8%1.0585
Daily Pivot Point S11.0517
Daily Pivot Point S21.0488
Daily Pivot Point S31.0439
Daily Pivot Point R11.0596
Daily Pivot Point R21.0644
Daily Pivot Point R31.0674

Author

Sagar Dua

Sagar Dua

FXStreet

Sagar Dua is associated with the financial markets from his college days. Along with pursuing post-graduation in Commerce in 2014, he started his markets training with chart analysis.

More from Sagar Dua
Share:

Editor's Picks

AUD/USD falls from 0.7050 amid Iran uncertainty

AUD/USD is back in the red, falling from 0.7050 in the Asian session on Friday, reversing the previous day's goodish rebound from a nearly two-month low amid a modest US Dollar uptick. Iran downplayed Trump's claim that a deal has been approved and said that key issues, including the Strait of Hormuz and frozen funds, remain unresolved. This keeps a lid on optimism, which, along with Fed rate-hike bets, revives USD demand and weighs on the pair.

USD/JPY recovers above 160.00 as Mideast woes persist ahead of BoJ

USD/JPY recovers ground above 160.00 in the Asian session on Friday. Economic risks due to uncertainty in the Middle East undermine the Japanese Yen, while lifting the safe-haven US Dollar (USD) amid the US-Iran standoff. This acts as a tailwind for the pair, though fears of intervention could limit deeper JPY losses and cap the pair's rebound ahead of the BoJ meeting next week.

Gold sticks to losses amid Iran peace deal doubts and hawkish Fed bets

Gold attracts some sellers near the $4,246-$4,247 region during the Asian session, stalling the previous day's solid recovery move from its lowest level since November 2025. Mixed signals regarding a potential US-Iran peace deal revive demand for the safe-haven US Dollar.

Pi Network: Bulls attempt comeback as bearish strength fades

Pi Network (PI) is trading at around $0.120 after a modest recovery the previous day. Despite this recent rebound, traders should be cautious as a scheduled unlock of 14.8 million PI tokens on Friday could limit the token's recovery potential by increasing market supply. Meanwhile, the technical outlook is showing early signs of fading bearish momentum, suggesting a short-term bounce.

U.S. economic outlook: The Warsh era starts with a great debate

Warsh is starting his tenure at the Fed during a transition of sorts. Given the prior FOMC statement and the countless Fed speakers we’ve heard from since then, it seems Fed officials are in the midst of shifting toward a more neutral policy stance.

4.2% headline, 0.2% core: Why the Fed's next hike may be targeting the wrong problem

May's CPI put headline inflation at 4.2% on the year, up from 3.8% in April and the hottest reading since April 2023, while core prices rose just 0.2% on the month, undershooting the 0.3% consensus and halving April's pace.