|

EUR/USD Price Analysis: Inches closer to 1.1420-10 support zone

  • EUR/USD remains heavy near the lowest levels in 16 months.
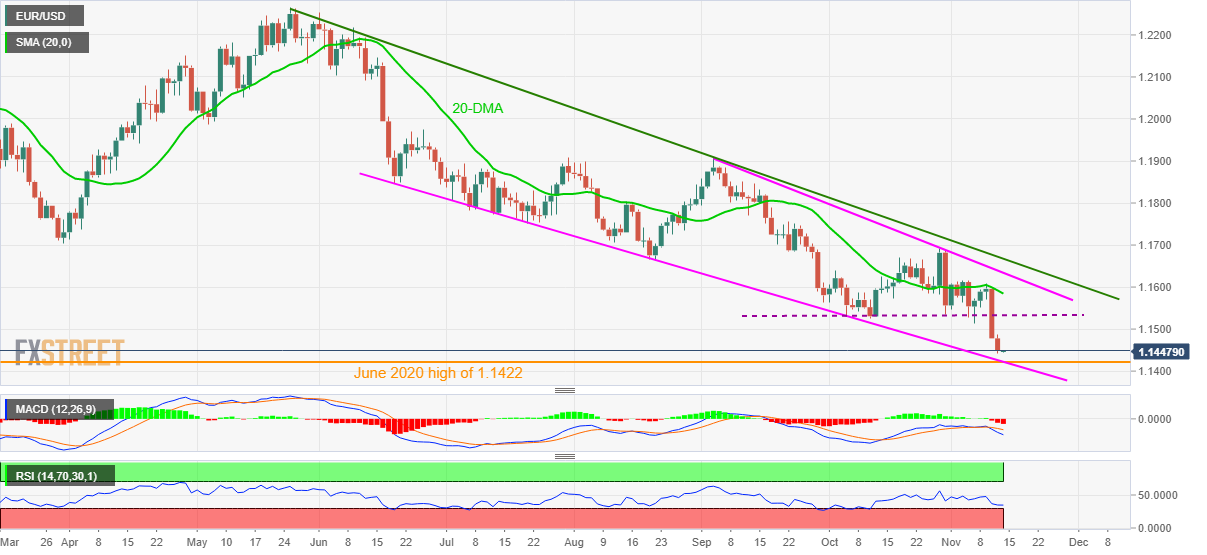
  • Bearish MACD, sustained trading below October’s trough allow sellers extra time.
  • Five-month-old support line joins June 2020 peak to highlight 1.1420-10 as the key area.
  • Monthly horizontal line guards immediate upside ahead of 20-DMA.

EUR/USD bears take a breather around the July 2020 levels following a two-day downtrend, taking rounds to 1.1450 during Friday’s early Asian session.

The major currency pair’s slump could be linked to the clear downside break of a horizontal area comprising multiple levels marked since early October. Also favoring sellers are the bearish MACD signals.

However, a convergence of a five-month-long descending trend line and high marked in June 2020 offer a tough nut a crack for the EUR/USD sellers around 1.1420-10 zone. The nearly oversold RSI conditions also highlight the importance of the said support region.

It’s worth noting that the 1.1400 threshold adds to the downside filter and allows counter-trend traders an extra opportunity for taking the risk.

On the other hand, corrective pullback remains less lucrative until the quote stay below one-month-old horizontal resistance, previous support around 1.1530.

Following that, the 20-DMA and a descending resistance line from September, respectively around 1.1585 and 1.1635, will be in focus.

Adding to the upside filters is the downward sloping trend line from May, close to 1.1670 at the latest.

EUR/USD: Daily chart

Trend: Further declines limited

Additional important levels

Overview
Today last price1.1451
Today Daily Change-0.0027
Today Daily Change %-0.24%
Today daily open1.1478
 
Trends
Daily SMA201.1599
Daily SMA501.1663
Daily SMA1001.1736
Daily SMA2001.1884
 
Levels
Previous Daily High1.1597
Previous Daily Low1.1478
Previous Weekly High1.1616
Previous Weekly Low1.1513
Previous Monthly High1.1692
Previous Monthly Low1.1524
Daily Fibonacci 38.2%1.1523
Daily Fibonacci 61.8%1.1551
Daily Pivot Point S11.1438
Daily Pivot Point S21.1399
Daily Pivot Point S31.1319
Daily Pivot Point R11.1557
Daily Pivot Point R21.1636
Daily Pivot Point R31.1676

Author

Anil Panchal

Anil Panchal

FXStreet

Anil Panchal has nearly 15 years of experience in tracking financial markets. With a keen interest in macroeconomics, Anil aptly tracks global news/updates and stays well-informed about the global financial moves and their implications.

More from Anil Panchal
Share:

Editor's Picks

EUR/USD gathers traction, approaches 1.1800

EUR/USD manages to reverse Tuesday’s pullback, advancing to two-day highs near the 1.1800 hurdle in the latter part of Wednesday’s session. The pair’s decent uptick comes on the back of the modest retracement in the US Dollar, as investors continue to closely follow developments on the trade front and news from the White House in the wake of President Trump’s SOTU speech.

GBP/USD challenges multi-day highs near 1.3530

GBP/USD leaves behind the previous day’s decline and regains fresh upside traction on Wednesday, surpassing the 1.3500 barrier in a context of a modest decline in the Greenback and a generalised improved mood in the risk-linked space. Meanwhile, the US tariff narrative continues to dictate the mood among market participants after Presidet Trump’s SOTU speech failed to surprise markets.

Gold remains bid and close to $5,200

Gold buyers are returning to the fold on Wednesday, targeting the $5,200 area and possibly beyond, after Tuesday’s corrective dip from monthly highs. The rebound in the precious metal comes as the US Dollar loses traction, with Trump’s SOTU speech offering little fresh direction and AI-related nerves continuing to ease.

Crypto Today: Bitcoin, Ethereum, XRP test rebound strength as ETF inflows return

Bitcoin, Ethereum and Ripple are gaining traction at the time of writing on Wednesday, amid persistent market doldrums. The Crypto King is up over 2% intraday, trading above $65,000 from the day’s opening of $64,058.

Nvidia earnings to influence AI trade and broader market sentiment

For the last three years, Nvidia has been the engine of the AI boom, and now Wall Street is watching to see whether that momentum can keep going. High-growth stocks have been struggling to maintain their bullish trend in 2026.

Cosmos Hub Price Forecast: ATOM rebounds slightly, bearish outlook remains intact

Cosmos Hub (ATOM) price rebounds, trading above $2.05 at the time of writing on Wednesday, after undergoing a sharp correction since last week. Weakening on-chain and derivatives data support a bearish outlook, while technical analysis remains unfavorable.