|

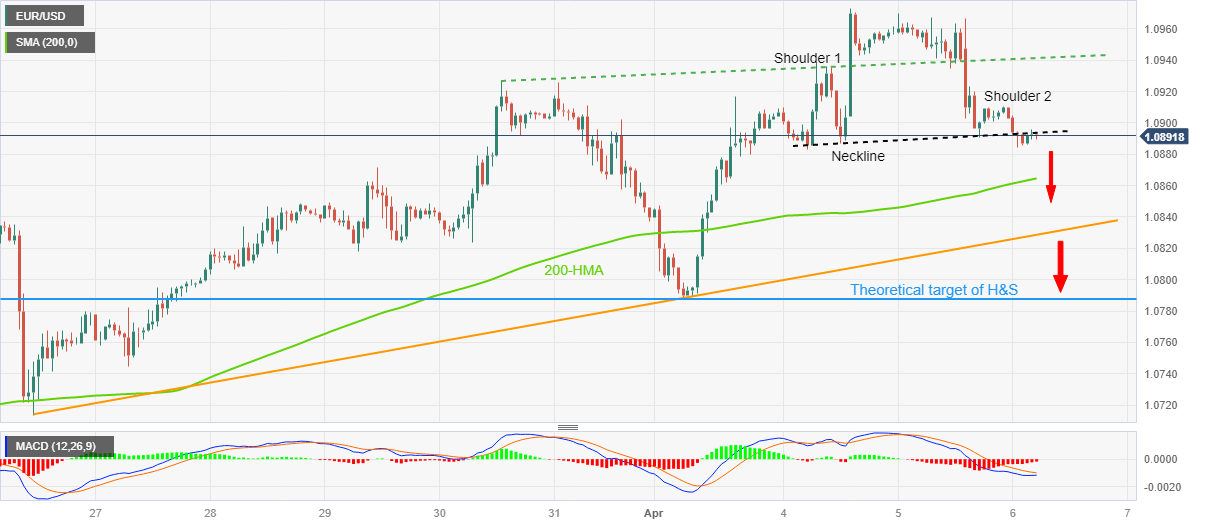
EUR/USD Price Analysis: H&S confirmation favors Euro bears around 1.0890

  • EUR/USD holds lower ground after confirming a bearish chart formation, sidelined of late.
  • Recovery remains elusive below 1.0950 even as MACD signals test Euro sellers of late.
  • 200-HMA, fortnight-old support line can act as intermediate halt during theoretical south-run targeting 1.0790.

EUR/USD prints mild losses around 1.0890 during the two-day downtrend heading into Thursday’s European session. In doing so, the Euro pair extends the previous day’s pullback from a two-month high after confirming a bearish “Head and Shoulders” (H&S) chart pattern on the hourly play.

It’s worth noting, however, that a light calendar and receding strength of the bearish MACD signals seem to challenge the EUR/USD sellers of late.

The Euro pair remains on the bear’s radar unless crossing the 1.0900 support-turned-resistance, comprising the neckline of the stated H&S formation.

Following that, a one-week-old ascending resistance line around 1.0950 can act as the last defense of the EUR/USD bears before targeting the latest swing high of 1.0975.

Should the EUR/USD buyers keep the reins past 1.0975, the 1.1000 psychological magnet and the Year-To-Date (YTD) high of 1.1033 will be in focus.

Alternatively, the 200-Hour Moving Average (HMA) precedes a two-week-long ascending trend line to restrict short-term EUR/USD downside around 1.0865 and 1.0830 in that order.

It’s worth observing that the H&S confirmation flashes the theoretical target of 1.0790 which is near the weekly bottom.

Hence, EUR/USD is well-set for further declines despite the latest inaction.

EUR/USD: Hourly chart

Trend: Further downside expected

Additional important levels

Overview
Today last price1.0892
Today Daily Change-0.0012
Today Daily Change %-0.11
Today daily open1.0904
 
Trends
Daily SMA201.0773
Daily SMA501.0733
Daily SMA1001.0668
Daily SMA2001.0348
 
Levels
Previous Daily High1.097
Previous Daily Low1.0891
Previous Weekly High1.0926
Previous Weekly Low1.0745
Previous Monthly High1.093
Previous Monthly Low1.0516
Daily Fibonacci 38.2%1.0921
Daily Fibonacci 61.8%1.094
Daily Pivot Point S11.0874
Daily Pivot Point S21.0843
Daily Pivot Point S31.0795
Daily Pivot Point R11.0952
Daily Pivot Point R21.1
Daily Pivot Point R31.1031

Author

Anil Panchal

Anil Panchal

FXStreet

Anil Panchal has nearly 15 years of experience in tracking financial markets. With a keen interest in macroeconomics, Anil aptly tracks global news/updates and stays well-informed about the global financial moves and their implications.

More from Anil Panchal
Share:

Editor's Picks

EUR/USD eyes nine-day EMA barrier after rebounding from 1.1600

EUR/USD gains ground after registering modest losses in the previous session, trading around 1.1620 during the Asian hours on Friday. The technical analysis of the daily chart suggests an ongoing bearish bias as the pair remains within the descending channel pattern.

GBP/USD: Pound Sterling ticks up against US Dollar in countdown to US NFP

The Pound Sterling trades marginally higher to near 1.3365 against the US Dollar during the Asian trading session on Friday. The GBP/USD pair edges up as the US Dollar ticks down ahead of the United States Nonfarm Payrolls data for February, which will be published at 13:30 GMT.

Gold awaits US Nonfarm Payrolls for a clear directional impetus

Gold rebounds above $5,100 early Friday after testing the $5,050 level amid global sell-off. The US Dollar pulls back as profit-taking creeps in ahead of US labor data. For February. 21-day SMA holds amid bullish RSI; a daily closing above 61.8% Fibo is critical for Gold buyers.

Ethereum pull in $169M as validators pile in to stake ETH

US spot Ethereum exchange-traded funds recorded $169 million in net inflows on Wednesday, marking the largest daily intake in two months, according to SoSoValue data. The rise in inflows signals renewed institutional interest in Ethereum amid broader market volatility.

The market compass is pointing at a barrel of Oil

The Asian open is arriving with equities leaning the wrong way, and the reason is not complicated. The market’s compass needle has snapped firmly toward crude. In this tape, oil is not just another input price; it is the gravitational center around which every asset class is orbiting.

Ripple tests recovery strength amid steady ETF inflows, growing retail interest

Ripple (XRP) continues to demonstrate notable resilience as the cryptocurrency market navigates the persistent war in the Middle East after the United States (US) and Israel attacked Iran on Saturday.