|

EUR/USD Price Analysis: Hovers around the major level of 1.0850

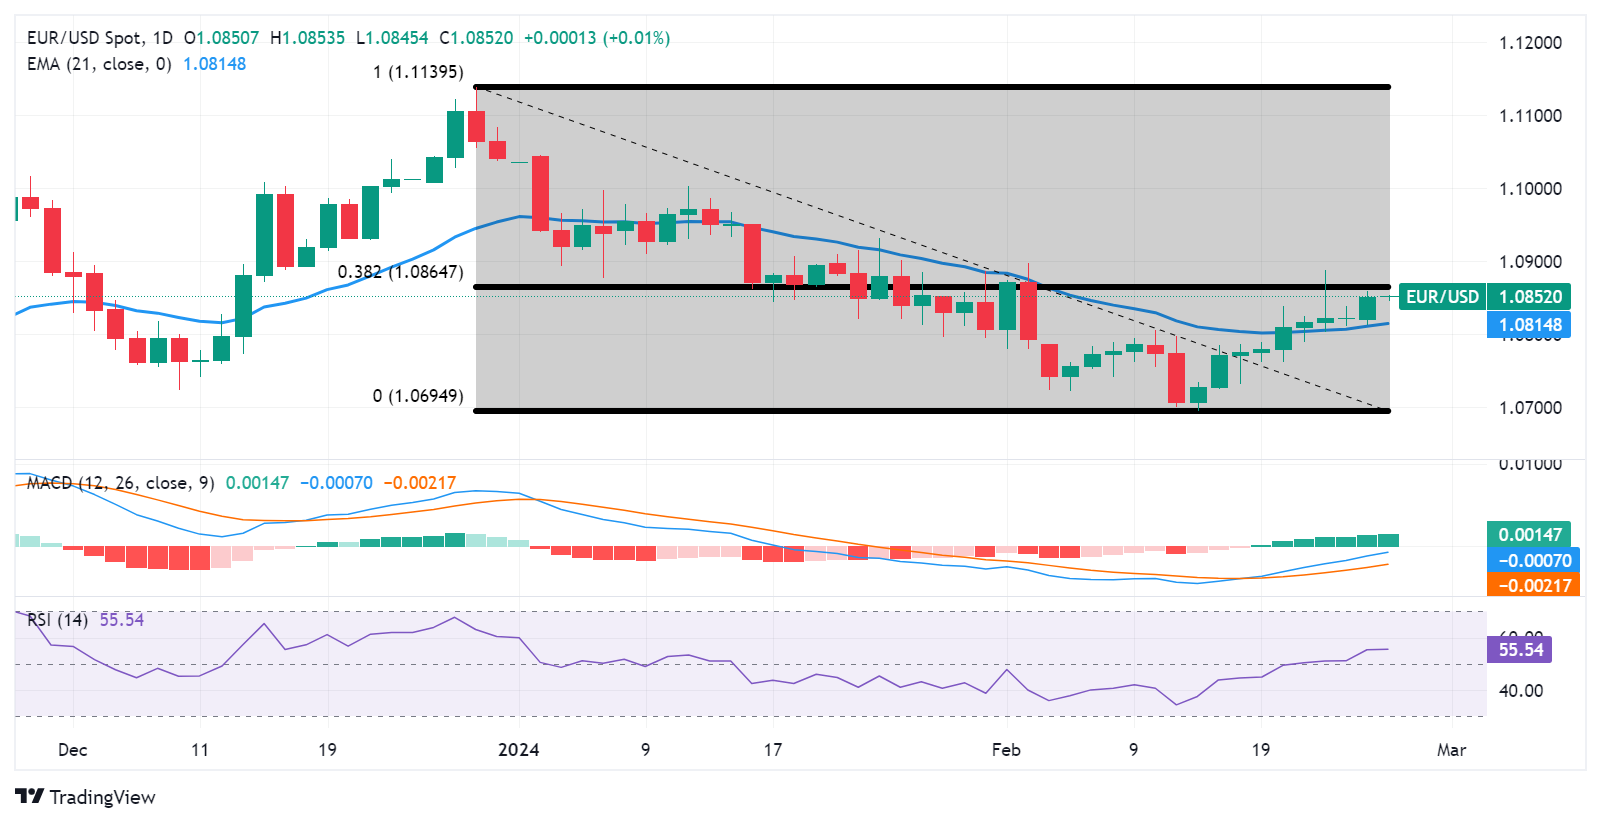
  • EUR/USD could meet the immediate resistance at the 38.2% Fibonacci retracement level of 1.0864.
  • The lagging indicator MACD implies a potential shift towards bullish momentum for the pair.
  • The key support area appears around the 21-day EMA at 1.0814 and the psychological level of 1.0800.

EUR/USD continues its winning streak that began on February 14, with the subdued US Dollar (USD), potentially influenced by the lower US Treasury yields. Consequently, during Tuesday's Asian session, the EUR/USD pair hovers around 1.0850.

Immediate resistance levels for the EUR/USD pair are identified at the 38.2% Fibonacci retracement level of 1.0864, followed by February's high of 1.0897, which aligns with the significant psychological barrier at 1.0900.

The technical analysis suggests a bullish sentiment for the EUR/USD pair. The 14-day Relative Strength Index (RSI) is positioned above the 50 mark, indicating strength in the upward momentum.

Additionally, the Moving Average Convergence Divergence (MACD) shows a divergence above the signal line, despite being below the centerline. This lagging indicator implies a potential shift towards bullish momentum for the EUR/USD pair.

On the downside, the EUR/USD pair could find the key support around the 21-day Exponential Moving Average (EMA) at 1.0814 followed by the psychological support of 1.0800 level. A break below this level could prompt the pair to retest February’s low at 1.0694 level.

EUR/USD: Daily Chart
EUR/USD

Overview
Today last price1.0852
Today Daily Change0.0001
Today Daily Change %0.01
Today daily open1.0851
 
Trends
Daily SMA201.0791
Daily SMA501.0884
Daily SMA1001.0815
Daily SMA2001.0828
 
Levels
Previous Daily High1.086
Previous Daily Low1.0813
Previous Weekly High1.0888
Previous Weekly Low1.0762
Previous Monthly High1.1046
Previous Monthly Low1.0795
Daily Fibonacci 38.2%1.0842
Daily Fibonacci 61.8%1.0831
Daily Pivot Point S11.0822
Daily Pivot Point S21.0794
Daily Pivot Point S31.0775
Daily Pivot Point R11.0869
Daily Pivot Point R21.0888
Daily Pivot Point R31.0917

Author

Akhtar Faruqui

Akhtar Faruqui is a Forex Analyst based in New Delhi, India. With a keen eye for market trends and a passion for dissecting complex financial dynamics, he is dedicated to delivering accurate and insightful Forex news and analysis.


More from Akhtar Faruqui
Share:

Editor's Picks

GBP/USD keeps the vacillating tone near 1.3650

GBP/USD struggles to extend its ongoimg recovery on Monday, this time flirting with the 1.3650 zone. Indeed, Cable trades without clear direction, although it manages well to maintain its business in the upper end of the recent range, challenging multi-week tops despite the decent recovery in the Greenback.

EUR/USD drifts lower to the 1.1670 zone

EUR/USD navigates a tight range at the beginning of the week, hovering around the 1.1670 region amid humble losses. The pair’s decline follows a decent advance in the US Dollar while investors continue to closely follow developments from the US money market.

Gold pushes harder; focus is now on $4,700

Gold keeps its bullish pace well and sound and approaches the $4,700 mark per troy ounce for the first time since early May. The precious metal’s move higher comes despite slight gains in the US Dollar and a modest pullback in US Treasury yields across the curve.

Here's what I learned trading meme coins
I’ve been trading cryptocurrencies for the past seven years, with meme coins becoming one of the most exciting and implacable parts of my experience. I love them because they represent internet culture and community sentiment, and, let’s be honest, extreme speculation. Newly launched meme coins were especially tempting: get in early enough, I thought, and a small bet could turn into a huge return.
Bessent’s presser in focus
Preview: Busy week ahead, with Bessent kicking this off today, with things wrapping up with Warsh at Jackson Hole. For a month that should have been a temporary period of ‘quiet’, we had anything but last week, with the bond market and tariffs front and centre.
$20 billion offered, $2 billion taken: Why Treasury doubled its buyback cap

The US Treasury moved off its own calendar on Wednesday, and that is the part worth sitting with. At 12:32 GMT, the department said it would at least double the size of liquidity support buyback operations in the 10-year to 20-year and 20-year to 30-year sectors, lifting the maximum from $2 billion per operation to at least $4 billion, effective September 9 and running to November 4.















