|

EUR/USD Price Analysis: Holds below 1.0750 ahead of US Retail Sales data

  • EUR/USD weakens around 1.0730 in Tuesday’s early European session. 
  • The negative outlook of the pair remains intact below the key 100-period EMA, with a bearish RSI indicator. 
  • The initial support level is seen at 1.0685; the key resistance level is located in the 1.0790–1.0800 zone. 

The EUR/USD pair trades on a softer note near 1.0730 on Tuesday during the early European trading hours. The modest recovery of the Greenback drags the major pair lower. Traders prefer to wait on the sidelines ahead of the Eurozone Harmonized Index of Consumer Prices (HICP) inflation data and the US Retail Sales data. Retail Sales in the US are expected to rise 0.2% MoM in May. 

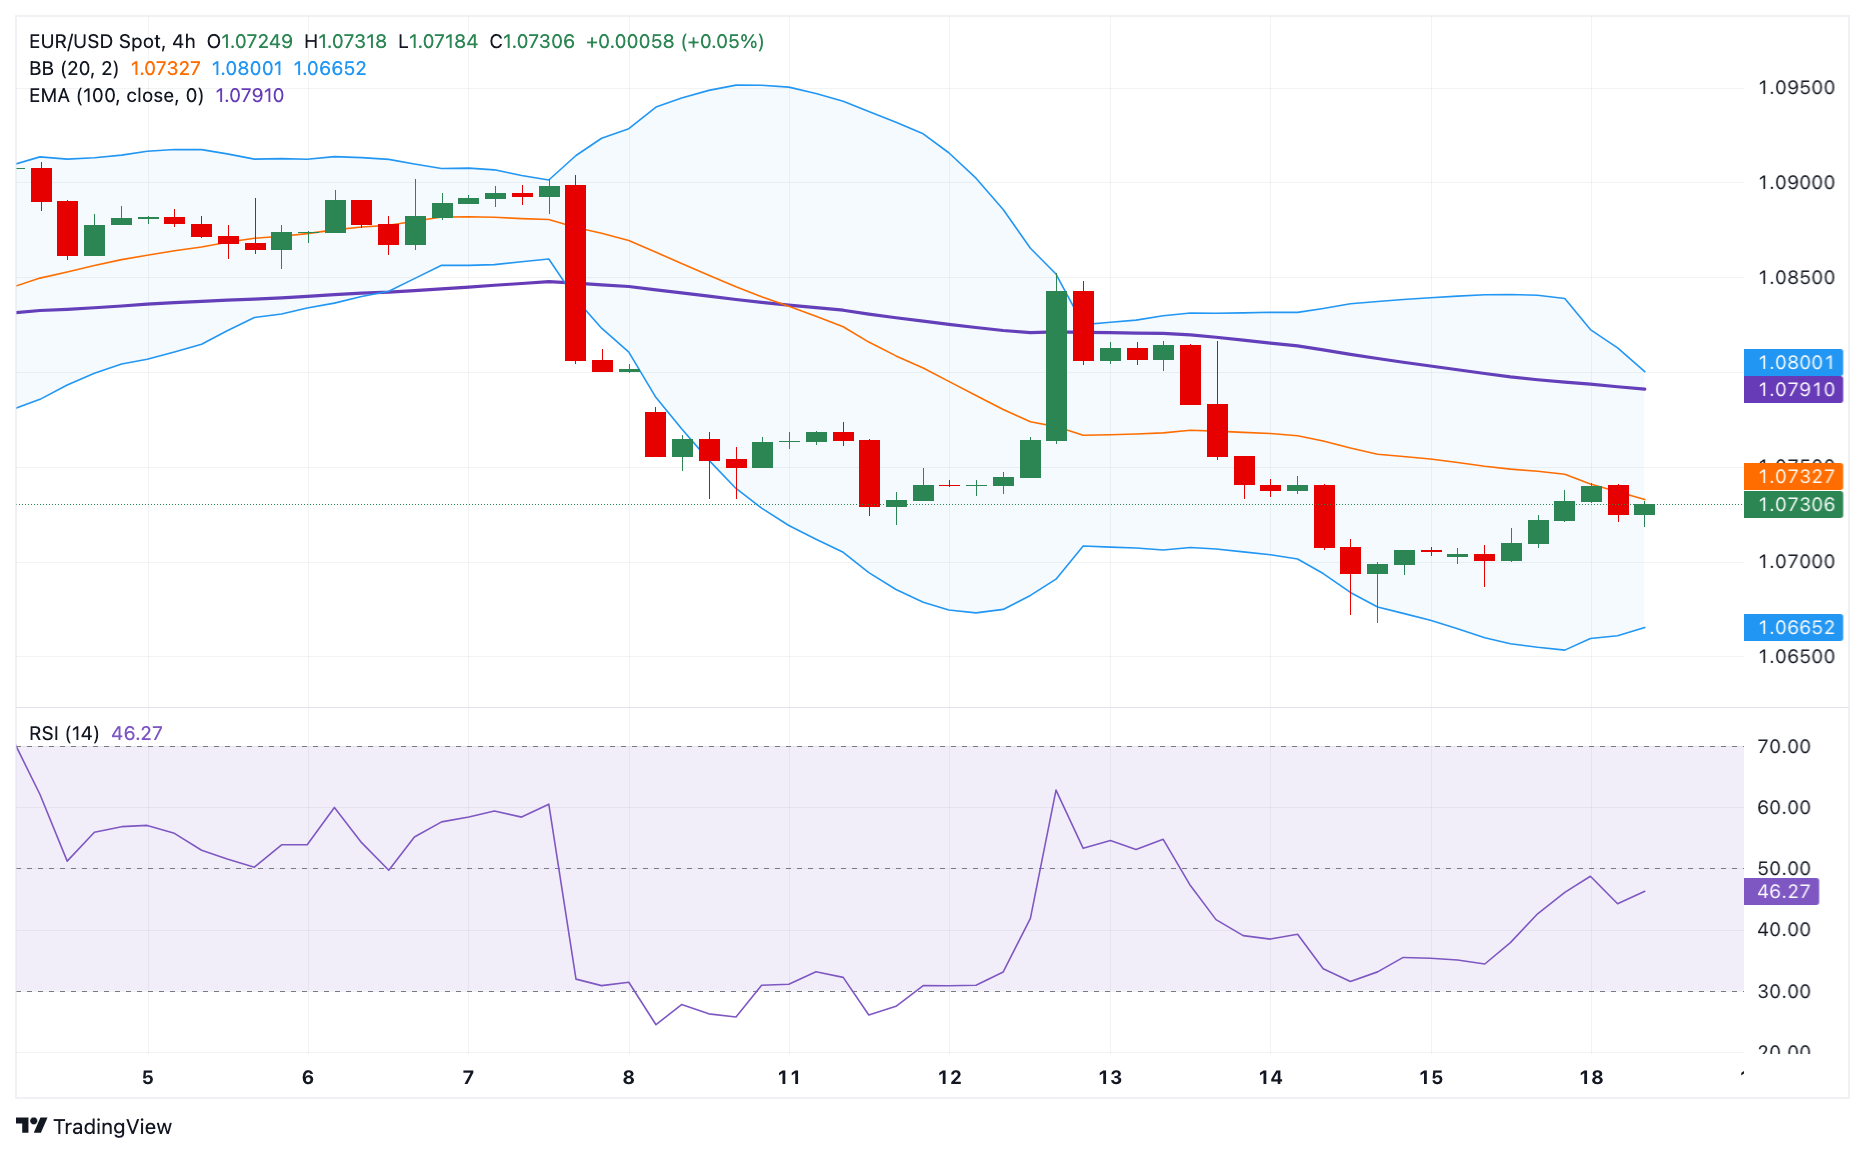
According to the 4-hour chart, EUR/USD keeps the bearish vibe unchanged as the major pair holds below the key 100-period Exponential Moving Average (EMA). The downward momentum is supported by the Relative Strength Index (RSI), which stands in the bearish zone near 43.0,. This suggests that the path of least resistance is to the downside. 

The initial support level for the major pair is seen at 1.0685, a low of  June 17. Further south, the downside target to watch is 1.0665, the lower limit of Bollinger Band. A break below the latter will see a drop to 1.0610, a low of April 19. 

On the upside, any follow-through buying above an intraday high of 1.0741 will see a rally to the crucial upside barrier at the 1.0790–1.0800 region. The mentioned level is the confluence of the upper boundary of the Bollinger Band and the psychological level. A break above this level will pave the way to 1.0852, a high of June 12. 

EUR/USD 4-hour chart

EUR/USD

Overview
Today last price1.0725
Today Daily Change-0.0009
Today Daily Change %-0.08
Today daily open1.0734
 
Trends
Daily SMA201.0819
Daily SMA501.0771
Daily SMA1001.08
Daily SMA2001.0789
 
Levels
Previous Daily High1.0738
Previous Daily Low1.0686
Previous Weekly High1.0852
Previous Weekly Low1.0668
Previous Monthly High1.0895
Previous Monthly Low1.065
Daily Fibonacci 38.2%1.0718
Daily Fibonacci 61.8%1.0706
Daily Pivot Point S11.0701
Daily Pivot Point S21.0668
Daily Pivot Point S31.065
Daily Pivot Point R11.0753
Daily Pivot Point R21.0771
Daily Pivot Point R31.0804

Author

Lallalit Srijandorn

Lallalit Srijandorn is a Parisian at heart. She has lived in France since 2019 and now becomes a digital entrepreneur based in Paris and Bangkok.

More from Lallalit Srijandorn
Share:

Editor's Picks

EUR/USD seems fragile below 1.1700 as Middle East war boosts energy prices

The EUR/USD pair trades flat at around 1.1680 during the Asian trading session on Tuesday, but broadly seems vulnerable, being close to its five-week low. The major currency pair is under pressure as surging oil prices due to the United States-Israel war with Iran have increased the risks of higher inflation for the Old Continent.

GBP/USD hovers around 1.3400 with bearish pressure intact

GBP/USD edges higher after three days of losses, trading around 1.3400 during the Asian hours on Tuesday. The technical analysis of the daily chart indicates an ongoing bearish bias, as the pair trades within a descending channel pattern.

Gold stays bullish as Iran war continues to spur safe-haven flows

Gold is finding renewed bids in Asian trades on Tuesday, making another attempt to regain the $5,400 level amid persistent demand for safe-haven assets as the Iran war extends. A softer risk tone remains in play as US President Donald Trump continues to threaten deeper escalation to the ongoing war with Iran, warning that a “big wave” is yet to come.

Top Crypto Gainers: Near Protocol, Virtuals Protocol, and Morpho lead market recovery

Near Protocol, Virtuals Protocol, and Morpho are leading the market recovery with double-digit gains over the last 24 hours. Technically, NEAR extends the breakout of the falling channel pattern, VIRTUAL holds above the 50-day EMA, while MORPHO tests a crucial resistance. 

The market is not panicking it is repricing the probability distribution of Oil and time

At the end of the day, markets do not trade morality or geopolitics. They trade transmission channels. And the only channel that truly matters in this maelstrom runs through the price of energy and the time value of money.

Grass 20% bullish breakout defies broader market weakness

Grass (GRASS) is edging up above $0.30 at the time of writing on Monday. The token’s notable 20% intraday surge stands out amid heightened volatility in the broader crypto market.