EUR/USD Price Analysis: Has room to rise towards 1.1715 amid bullish technical set up


  • EUR/USD is breaking higher from a three-week-old descending triangle on the daily chart.
  • Tuesday’s close is critical to unleashing additional upside towards the 50-DMA at 1.1715.
  • Daily RSI pierces through the midline, recaptures 50.00 and backs more gains.

EUR/USD is consolidating around 1.1650, having staged an impressive bounce from the daily lows of 1.1610, as the pullback in the US dollar amid the risk-on mood underpinned the pair.

The major extends its recovery from 15-month lows of 1.1524 into the fifth straight day on Tuesday, as the bulls remain in complete control.

EUR/USD’s daily chart shows that the price has broken higher from a three-week-old descending triangle formation, although the bulls need a daily closing above the falling trendline resistance at 1.1602 to confirm an upside breakout from the pattern.

The 14-day Relative Strength Index (RSI) has pierced through the midline, now back onto the positive territory, suggesting that there is more room to the upside.

The triangle confirmation will trigger a fresh advance towards the downward-sloping 50-Daily Moving Average (DMA) at 1.1715.

Ahead of that the 1.1700 round number could be a tough nut to crack for the EUR bulls.

EUR/USD: Daily chart

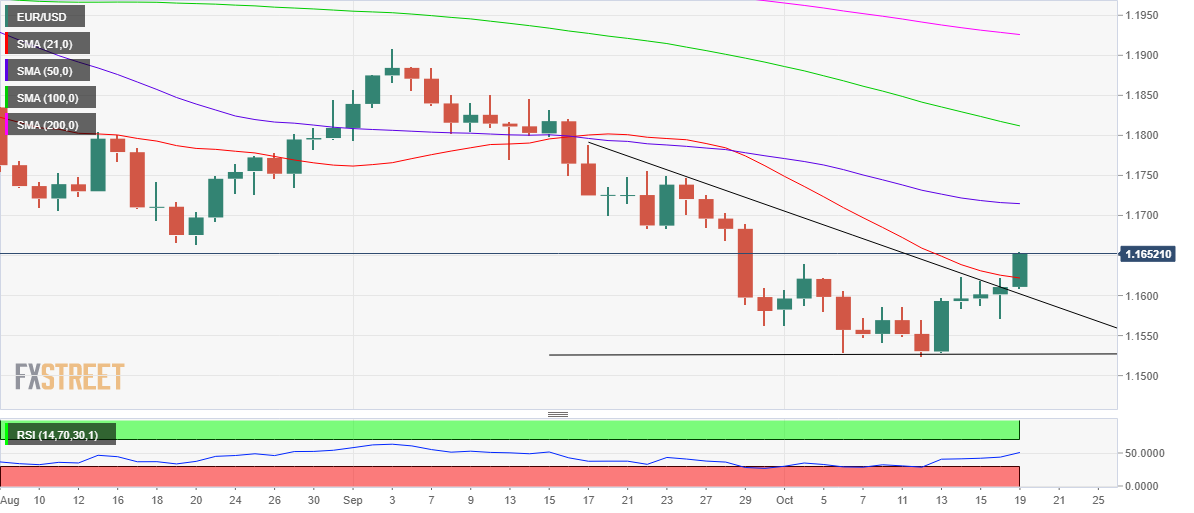
Meanwhile, any retracement will meet the 21-DMA support at 1.1622, below which the triangle resistance now support at 1.1602 would be tested once again.

Further south, Monday’s low of 1.1571 could be threatened if the selling pressure intensifies.

EUR/USD: Additional levels to consider

EUR/USD

Overview
Today last price 1.1652
Today Daily Change 0.0041
Today Daily Change % 0.35
Today daily open 1.1611
 
Trends
Daily SMA20 1.162
Daily SMA50 1.1716
Daily SMA100 1.1818
Daily SMA200 1.1929
 
Levels
Previous Daily High 1.1622
Previous Daily Low 1.1572
Previous Weekly High 1.1624
Previous Weekly Low 1.1524
Previous Monthly High 1.1909
Previous Monthly Low 1.1563
Daily Fibonacci 38.2% 1.1603
Daily Fibonacci 61.8% 1.1591
Daily Pivot Point S1 1.1581
Daily Pivot Point S2 1.1551
Daily Pivot Point S3 1.153
Daily Pivot Point R1 1.1631
Daily Pivot Point R2 1.1652
Daily Pivot Point R3 1.1682


Share: Feed news

Information on these pages contains forward-looking statements that involve risks and uncertainties. Markets and instruments profiled on this page are for informational purposes only and should not in any way come across as a recommendation to buy or sell in these assets. You should do your own thorough research before making any investment decisions. FXStreet does not in any way guarantee that this information is free from mistakes, errors, or material misstatements. It also does not guarantee that this information is of a timely nature. Investing in Open Markets involves a great deal of risk, including the loss of all or a portion of your investment, as well as emotional distress. All risks, losses and costs associated with investing, including total loss of principal, are your responsibility. The views and opinions expressed in this article are those of the authors and do not necessarily reflect the official policy or position of FXStreet nor its advertisers. The author will not be held responsible for information that is found at the end of links posted on this page.

If not otherwise explicitly mentioned in the body of the article, at the time of writing, the author has no position in any stock mentioned in this article and no business relationship with any company mentioned. The author has not received compensation for writing this article, other than from FXStreet.

FXStreet and the author do not provide personalized recommendations. The author makes no representations as to the accuracy, completeness, or suitability of this information. FXStreet and the author will not be liable for any errors, omissions or any losses, injuries or damages arising from this information and its display or use. Errors and omissions excepted.

The author and FXStreet are not registered investment advisors and nothing in this article is intended to be investment advice.

Recommended content


Recommended content

Editors’ Picks

AUD/USD remained bid above 0.6500

AUD/USD remained bid above 0.6500

AUD/USD extended further its bullish performance, advancing for the fourth session in a row on Thursday, although a sustainable breakout of the key 200-day SMA at 0.6526 still remain elusive.

AUD/USD News

EUR/USD faces a minor resistance near at 1.0750

EUR/USD faces a minor resistance near at 1.0750

EUR/USD quickly left behind Wednesday’s small downtick and resumed its uptrend north of 1.0700 the figure, always on the back of the persistent sell-off in the US Dollar ahead of key PCE data on Friday.

EUR/USD News

Gold holds around $2,330 after dismal US data

Gold holds around $2,330 after dismal US data

Gold fell below $2,320 in the early American session as US yields shot higher after the data showed a significant increase in the US GDP price deflator in Q1. With safe-haven flows dominating the markets, however, XAU/USD reversed its direction and rose above $2,340.

Gold News

Bitcoin price continues to get rejected from $65K resistance as SEC delays decision on spot BTC ETF options

Bitcoin price continues to get rejected from $65K resistance as SEC delays decision on spot BTC ETF options

Bitcoin (BTC) price has markets in disarray, provoking a broader market crash as it slumped to the $62,000 range on Thursday. Meanwhile, reverberations from spot BTC exchange-traded funds (ETFs) continue to influence the market.

Read more

US economy: slower growth with stronger inflation

US economy: slower growth with stronger inflation

The dollar strengthened, and stocks fell after statistical data from the US. The focus was on the preliminary estimate of GDP for the first quarter. Annualised quarterly growth came in at just 1.6%, down from the 2.5% and 3.4% previously forecast.

Read more

Forex MAJORS

Cryptocurrencies

Signatures