|

EUR/USD Price Analysis: Finds support around 1.0670 as chances of steady policy by Fed soar

  • EUR/USD has sensed a cushion around 1.0670 amid an improvement in investors’ risk appetite.
  • The Fed is expected to remain steady or hike interest rates by 25 bps on order to maintain pressure on inflation.
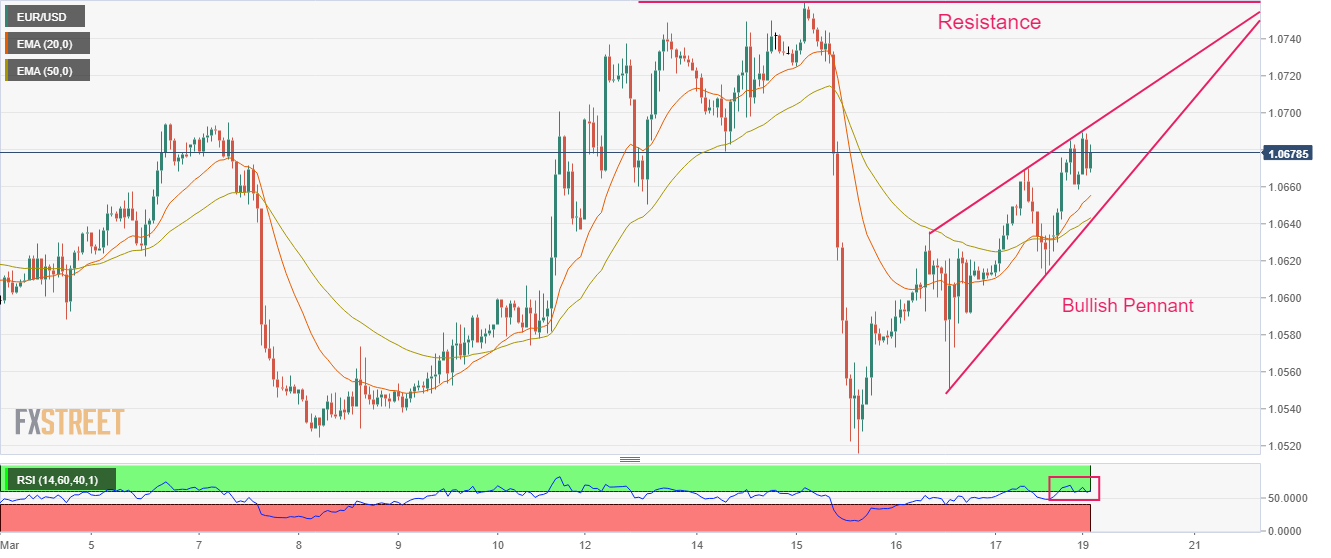
  • EUR/USD is auctioning in a Bullish Pennant chart pattern that indicates an upside momentum.

The EUR/USD pair has found a cushion around 1.0670 in the early Tokyo session. The major currency pair is expected to recapture the round-level resistance of 1.0700 as investors are quite confident about a less-hawkish interest rate decision by the Federal Reserve (Fed), scheduled for Wednesday. Considering the declining trend in the United States inflation and banking debacle, the Fed is expected to remain steady or hike interest rates by 25 basis points (bps) on order to maintain pressure on inflation.

The US Dollar Index (DXY) is defending the 103.60 cushion, however, the downside seems favored as investors’ risk appetite is improving. S&P500 futures are showing strong recovery in early Asia after a battered Friday as the headline of UBS taking over Credit Suisse is infusing confidence among the market participants.

Sky News reported that under the takeover UBS will pay 3bn Swiss francs (£2.6bn) to acquire Credit Suisse. And, it has agreed to assume up to 5bn francs (£4.4bn) in losses, and 100bn Swiss francs (£88.5bn) in liquidity assistance will be available to both banks.

EUR/USD is auctioning in a Bullish Pennant chart pattern, which indicates that the asset is in upside momentum. Usually, the aforementioned chart pattern delivers a bearish reversal after reaching a point where the upside momentum gets exhausted.

A bull cross, represented by the 20-and 50-period Exponential Moving Averages (EMAs) at 1.0630, indicates more upside ahead.

The Relative Strength Index (RSI) (14) is working hard for a confident shift into the bullish range of 60.00-80.00, which would strengthen the Euro.

For an upside move, a decisive break above the round-level resistance of 1.0700 will drive the asset toward the horizontal resistance plotted from March 15 high at 1.0760 and February 14 high at 1.0804.

On the flip side, a downside break below March 17 low at 1.0612 would drag the shared currency pair toward March 16 low at 1.0551, followed by March 15 low at 1.0516.

EUR/USD hourly chart

EUR/USD

Overview
Today last price1.0681
Today Daily Change0.0014
Today Daily Change %0.13
Today daily open1.0667
 
Trends
Daily SMA201.0624
Daily SMA501.0728
Daily SMA1001.0569
Daily SMA2001.0326
 
Levels
Previous Daily High1.0685
Previous Daily Low1.0607
Previous Weekly High1.076
Previous Weekly Low1.0516
Previous Monthly High1.1033
Previous Monthly Low1.0533
Daily Fibonacci 38.2%1.0655
Daily Fibonacci 61.8%1.0637
Daily Pivot Point S11.0621
Daily Pivot Point S21.0574
Daily Pivot Point S31.0542
Daily Pivot Point R11.0699
Daily Pivot Point R21.0731
Daily Pivot Point R31.0778

Author

Sagar Dua

Sagar Dua

FXStreet

Sagar Dua is associated with the financial markets from his college days. Along with pursuing post-graduation in Commerce in 2014, he started his markets training with chart analysis.

More from Sagar Dua
Share:

Editor's Picks

EUR/USD seems fragile below 1.1700 as Middle East war boosts energy prices

The EUR/USD pair trades flat at around 1.1680 during the Asian trading session on Tuesday, but broadly seems vulnerable, being close to its five-week low. The major currency pair is under pressure as surging oil prices due to the United States-Israel war with Iran have increased the risks of higher inflation for the Old Continent.

GBP/USD hovers around 1.3400 with bearish pressure intact

GBP/USD edges higher after three days of losses, trading around 1.3400 during the Asian hours on Tuesday. The technical analysis of the daily chart indicates an ongoing bearish bias, as the pair trades within a descending channel pattern.

Gold stays bullish as Iran war continues to spur safe-haven flows

Gold is finding renewed bids in Asian trades on Tuesday, making another attempt to regain the $5,400 level amid persistent demand for safe-haven assets as the Iran war extends. A softer risk tone remains in play as US President Donald Trump continues to threaten deeper escalation to the ongoing war with Iran, warning that a “big wave” is yet to come.

Top Crypto Gainers: Near Protocol, Virtuals Protocol, and Morpho lead market recovery

Near Protocol, Virtuals Protocol, and Morpho are leading the market recovery with double-digit gains over the last 24 hours. Technically, NEAR extends the breakout of the falling channel pattern, VIRTUAL holds above the 50-day EMA, while MORPHO tests a crucial resistance. 

The market is not panicking it is repricing the probability distribution of Oil and time

At the end of the day, markets do not trade morality or geopolitics. They trade transmission channels. And the only channel that truly matters in this maelstrom runs through the price of energy and the time value of money.

Grass 20% bullish breakout defies broader market weakness

Grass (GRASS) is edging up above $0.30 at the time of writing on Monday. The token’s notable 20% intraday surge stands out amid heightened volatility in the broader crypto market.