|

EUR/USD Price Analysis: Euro fades bullish bias within monthly triangle, focus on 1.0920 and US inflation

  • EUR/USD snaps two-day winning streak but lacks follow-through amid sluggish session.
  • One-month-old symmetrical triangle restricts immediate Euro moves as US CPI week begins.
  • Failure to cross 200-SMA triggers pullback moves but oscillators keep EUR/USD buyers hopeful unless breaking 1.0920 support.

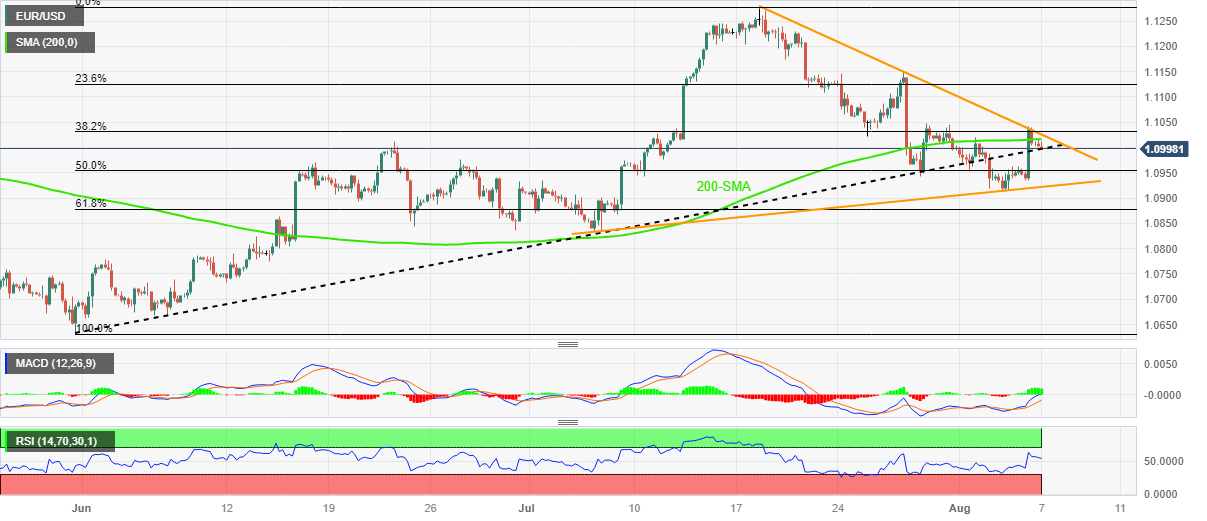
EUR/USD prints the first daily loss in three as it drops to 1.0995 while posting mild losses during the mid-Asian session on Monday. Even so, the Euro pair remains within a one-month-old symmetrical triangle, recently reversing from the top line and slipping back below the 200-SMA hurdle.

It’s worth noting that the previous support line from early July joins the bullish MACD signals and upbeat RSI (14) line to keep the Euro buyers hopeful as they await this week’s US inflation numbers, namely the Consumer Price Index (CPI) and Producer Price Index (PPI) for July.

Even if the quote breaks the 1.0990 immediate support, the 50% Fibonacci retracement of May-July upside, near 1.0950 and the stated triangle’s bottom line around 1.0920 will be crucial challenges for the EUR/USD bears to watch for retaking control.

Also likely to challenge the Euro sellers is the 61.8% Fibonacci retracement surrounding 1.0880 and the previous monthly low of around 1.0830.

Meanwhile, the 200-SMA level of around 1.1020 guards the immediate recovery of the EUR/USD pair ahead of the stated triangle’s top line, close to 1.1030 at the latest.

Following that, the late July swing high around 1.1050 may act as the last defense of the Euro bears before directing the quote towards the yearly of 1.1275.

EUR/USD: Four-hour chart

Trend: Limited downside expected

Additional important levels

Overview
Today last price1.0996
Today Daily Change-0.0013
Today Daily Change %-0.12%
Today daily open1.1009
 
Trends
Daily SMA201.108
Daily SMA501.0937
Daily SMA1001.092
Daily SMA2001.0745
 
Levels
Previous Daily High1.1042
Previous Daily Low1.0935
Previous Weekly High1.1046
Previous Weekly Low1.0912
Previous Monthly High1.1276
Previous Monthly Low1.0834
Daily Fibonacci 38.2%1.1001
Daily Fibonacci 61.8%1.0976
Daily Pivot Point S11.0948
Daily Pivot Point S21.0888
Daily Pivot Point S31.0841
Daily Pivot Point R11.1055
Daily Pivot Point R21.1102
Daily Pivot Point R31.1162

Author

Anil Panchal

Anil Panchal

FXStreet

Anil Panchal has nearly 15 years of experience in tracking financial markets. With a keen interest in macroeconomics, Anil aptly tracks global news/updates and stays well-informed about the global financial moves and their implications.

More from Anil Panchal
Share:

Editor's Picks

USD/JPY holds pullback from 161.80 on hawkish BoJ-speak

USD/JPY is holding above 161.00 in the Asian session on Friday, on a retreat from its highest level since July 2024 set the previous day. Hawkish BoJ commentary and April Minutes affirm further rate hike expectations, offsetting the softer Japanese National CPI print and support the Japanese Yen as intervention fears loom.

AUD/USD attacks 0.7000 amid stronger US Dollar

AUD/USD attacks 0.7000 in the Asian session on Friday, remaining close to the weekly low, and seems poised to register modest weekly losses. The US Dollar sits near its highest level since May 2025 as the Fed's hawkish tilt overshadows optimism over the US-Iran peace deal, weighing on the pair.

Gold remains a lose-lose trade despite the US-Iran peace deal

Gold extends three-day losing streak below $4,200, eyes third straight weekly loss. The US Dollar sits at yearly highs amid hawkish Fed outlook, renewed Iran tensions. Technically, Gold remains vulnerable, with a retest of $4,000 likely on the cards.

Bitcoin weakens, Ethereum turns lower, XRP faces channel rejection

Bitcoin, Ethereum, and Ripple are trading under pressure on Friday as risk-off continues to weigh on the broader cryptocurrency market. BTC has fallen more than 4% so far this week, and ETH is extending losses, trading around $1,700. Meanwhile, XRP faces rejection at the upper boundary of its parallel downward channel, hinting at further correction.

 Back above 100: Kevin Warsh’s first Fed meeting sparks US Dollar rally

The US Dollar Index did a phoenix comeback, rising from its ashes and reconquering 100. The reasons behind the US Dollar rally are pretty clear: the Memorandum of Understanding between the United States and Iran, and a hawkish Federal Reserve. Both events were long-awaited and much expected. However, the market reacted with surprise when there were no surprises at all.

The next big AI trade may not be about chips or software

Artificial intelligence has already created some of the biggest winners in modern market history. Chipmakers have surged, data centre construction is booming, and electricity demand forecasts are changing globally.