|

EUR/USD Price Analysis: Euro extends losses but 100-200 SMA crossover offers support

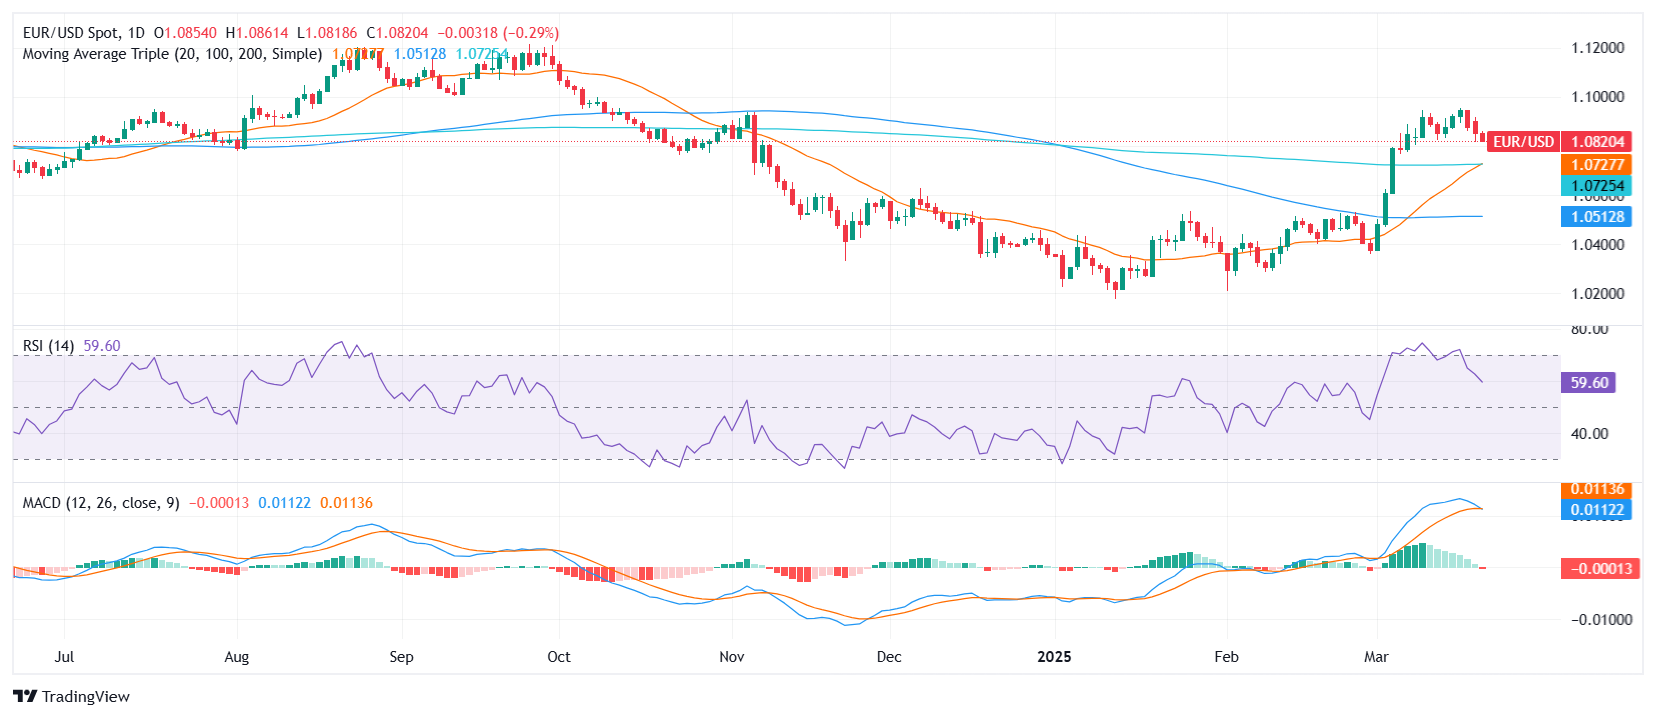
  • EUR/USD was seen trading around the 1.0820 area after the European session, falling for a third consecutive day.
  • Despite shedding over 1% this week, the recent bullish crossover between the 100- and 200-day SMAs may provide a strong base.
  • Momentum indicators turn bearish, with RSI dropping sharply and MACD printing a fresh red bar.

EUR/USD declined on Friday’s session after the European close, moving near the 1.0820 zone as the pair tallied a third straight day in the red. After a strong rally earlier in the month, the pair has lost over 1% this week, with momentum indicators now flashing bearish signals. Still, structural support remains firm as key moving averages align beneath current price levels.

The Relative Strength Index (RSI) has sharply retreated within positive territory and now hovers near neutral, hinting at fading bullish momentum. Meanwhile, the Moving Average Convergence Divergence (MACD) has shifted direction, printing a fresh red bar, which confirms weakening momentum in the short term.

From a broader perspective, a bullish crossover between the 100-day and 200-day Simple Moving Averages has taken shape this week, forming a solid technical floor near the 1.0730 region. This development helps cushion the downside, even if sellers continue to weigh on the pair in the near term.

Looking ahead, immediate support is seen at the 1.0780-1.0730 zone, where the moving average crossover occurred. A break below could expose further losses toward 1.0660. On the upside, resistance now sits at 1.0900, followed by 1.1000 should buyers regain control.

EUR/USD daily chart

Author

Patricio Martín

Patricio is an economist from Argentina passionate about global finance and understanding the daily movements of the markets.

More from Patricio Martín
Share:

Editor's Picks

EUR/USD looks to regain the 200-day SMA

EUR/USD regains some balance and trade just above 1.1600 the figure ahead of the opening bell in Asia. The pair initially dipped to the 1.1530 zone for the first time since November, always following the stronger US Dollar and the marked flight-to-safety in the context of the ongoing Middle East crisis
 

GBP/USD attacks 1.3300, refreshing three-month lows

GBP/USD is deep in the red near 1.3300, accelerating its downside to renew three-month lows in European trading on Tuesday. The ongoing escalation in the Iran war, combined with rising Oil prices, weighs negatively on the higher-yielding Pound Sterling as the US Dollar capitalizes on increased haven demand.

Gold bounces off lows, back above $5,100

Gold remains on the defensive, eroding part of the recent multi-day advance and managing to trade back above the $5,100 mark per troy ounce on Tuesday. The precious metal initially dropped just below the critical $5,000 threshold on the back of the persistent strength of the Greenback, higher US Treasury yields across the curve and investors' repricing of Fed rate cuts.

XRP risks extending losses as US-Iran war rages on

Ripple (XRP) has come under pressure, drifting lower to $1.35 at the time of writing on Tuesday. The over 2% correction looks poised to erase the previous day’s gains, which lifted the remittance token to $1.42.

Energy shock 2.0: Why rising Gas prices could hit the Euro

Even without a confirmed, sustained disruption, the mere risk to a key global energy chokepoint is enough to inject a significant premium into European Gas markets. And for the Euro, that matters.

Ripple falters amid sell-off jitters and negative funding rates

Ripple (XRP) has come under pressure, drifting lower to $1.35 at the time of writing on Tuesday. The over 2% correction looks poised to erase the previous day’s gains, which lifted the remittance token to $1.42.