EUR/USD Price Analysis: Euro bulls need validation from 100-day EMA and US NFP


  • EUR/USD bulls approach 100-day EMA hurdle after rising the most in seven weeks.
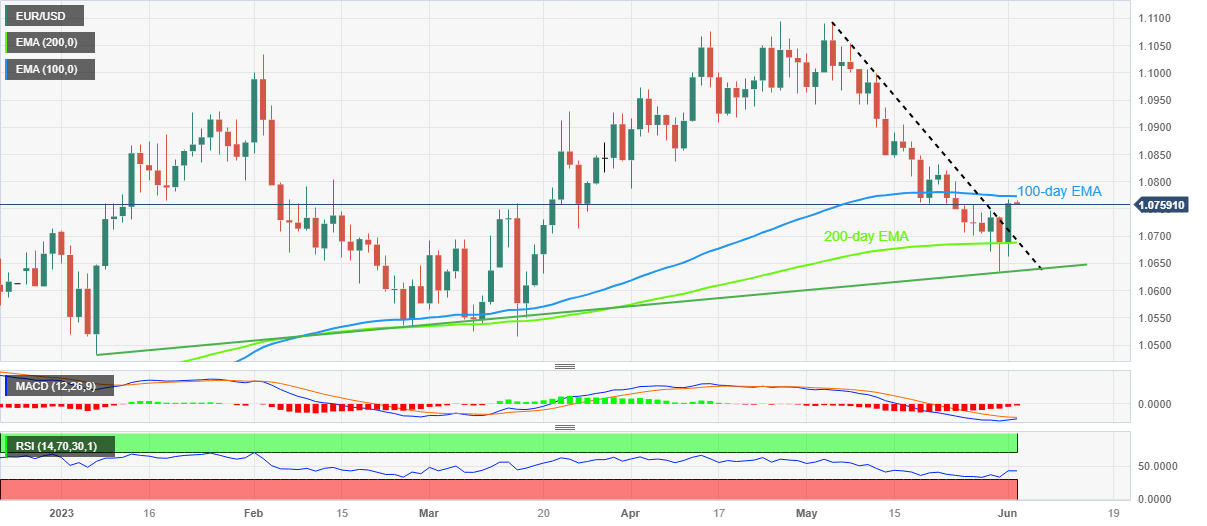
  • Clear rebound from multi-day-old ascending support line, 200-day EMA favors buyers.
  • 100-day EMA, downbeat RSI and US NFP may recall Euro bears in case of surprises.

EUR/USD seesaws around 1.0760 during Friday’s sluggish Asian session, after rising the most in nearly two months the previous day. In doing so, the Euro pair portrays the pre-NFP consolidation amid a cautious mood and a light calendar, as well as mixed technical catalysts.

Also read: Forex Today: The rally is finally here, and the Dollar knows it

That said, the Euro pair’s successful break of a one-month-old descending trend line joins the receding bearish bias of the MACD indicator to keep the EUR/USD bulls hopeful in crossing the immediate hurdle comprising the 100-day Exponential Moving Average (EMA) of near 1.0775.

However, the RSI (14) line remains below 50.0 and suggests a lack of upside momentum, which in turn may join a surprise improvement in the US jobs report, which is less likely, to recall the EUR/USD bears.

In a case where the EUR/USD crosses the 1.0775 hurdle, the 1.0800 round figure and the late May swing high near 1.0835 may prod the bulls.

On the flip side, a convergence of the previous resistance line and the 200-day EMA, around 1.0690-85, restrict immediate declines of the EUR/USD pair ahead of the previously mentioned rising support line from October 2022, close to 1.0635 at the latest.

It’s worth noting that the EUR/USD pair’s weakness past 1.0635 makes it vulnerable to drop toward the yearly low of around 1.0480 marked in January.

EUR/USD: Daily chart

Trend: Limited upside expected

Additional important levels

Overview
Today last price 1.076
Today Daily Change -0.0002
Today Daily Change % -0.02%
Today daily open 1.0762
 
Trends
Daily SMA20 1.0828
Daily SMA50 1.0898
Daily SMA100 1.0814
Daily SMA200 1.0498
 
Levels
Previous Daily High 1.0768
Previous Daily Low 1.0662
Previous Weekly High 1.0831
Previous Weekly Low 1.0702
Previous Monthly High 1.1092
Previous Monthly Low 1.0635
Daily Fibonacci 38.2% 1.0674
Daily Fibonacci 61.8% 1.0697
Daily Pivot Point S1 1.0693
Daily Pivot Point S2 1.0624
Daily Pivot Point S3 1.0587
Daily Pivot Point R1 1.08
Daily Pivot Point R2 1.0837
Daily Pivot Point R3 1.0906


Share: Feed news

Information on these pages contains forward-looking statements that involve risks and uncertainties. Markets and instruments profiled on this page are for informational purposes only and should not in any way come across as a recommendation to buy or sell in these assets. You should do your own thorough research before making any investment decisions. FXStreet does not in any way guarantee that this information is free from mistakes, errors, or material misstatements. It also does not guarantee that this information is of a timely nature. Investing in Open Markets involves a great deal of risk, including the loss of all or a portion of your investment, as well as emotional distress. All risks, losses and costs associated with investing, including total loss of principal, are your responsibility. The views and opinions expressed in this article are those of the authors and do not necessarily reflect the official policy or position of FXStreet nor its advertisers. The author will not be held responsible for information that is found at the end of links posted on this page.

If not otherwise explicitly mentioned in the body of the article, at the time of writing, the author has no position in any stock mentioned in this article and no business relationship with any company mentioned. The author has not received compensation for writing this article, other than from FXStreet.

FXStreet and the author do not provide personalized recommendations. The author makes no representations as to the accuracy, completeness, or suitability of this information. FXStreet and the author will not be liable for any errors, omissions or any losses, injuries or damages arising from this information and its display or use. Errors and omissions excepted.

The author and FXStreet are not registered investment advisors and nothing in this article is intended to be investment advice.

Recommended content


Recommended content

Editors’ Picks

AUD/USD jumps above 0.6500 after hot Australian CPI data

AUD/USD jumps above 0.6500 after hot Australian CPI data

AUD/USD extended gains and recaptured 0.6500 in Asian trading, following the release of hotter-than-expected Australian inflation data. The Australian CPI rose 1% in QoQ in Q1 against 0.8% forecast, providing extra legs to the Australian Dollar upside. 

AUD/USD News

USD/JPY hangs near 34-year high at 154.88 as intervention risks loom

USD/JPY hangs near 34-year high at 154.88 as intervention risks loom

USD/JPY is sitting at a multi-decade high of 154.88 reached on Tuesday. Traders refrain from placing fresh bets on the pair as Japan's FX intervention risks loom. Broad US Dollar weakness also caps the upside in the major. US Durable Goods data are next on tap. 

USD/JPY News

Gold price cautious despite weaker US Dollar and falling US yields

Gold price cautious despite weaker US Dollar and falling US yields

Gold retreats modestly after failing to sustain gains despite fall in US Treasury yields, weaker US Dollar. XAU/USD struggles to capitalize following release of weaker-than-expected S&P Global PMIs, fueling speculation about potential Fed rate cuts.

Gold News

Crypto community reacts as BRICS considers launching stablecoin for international trade settlement

Crypto community reacts as BRICS considers launching stablecoin for international trade settlement

BRICS is intensifying efforts to reduce its reliance on the US dollar after plans for its stablecoin effort surfaced online on Tuesday. Most people expect the stablecoin to be backed by gold, considering BRICS nations have been accumulating large holdings of the commodity.

Read more

US versus the Eurozone: Inflation divergence causes monetary desynchronization

US versus the Eurozone: Inflation divergence causes monetary desynchronization

Historically there is a very close correlation between changes in US Treasury yields and German Bund yields. This is relevant at the current juncture, considering that the recent hawkish twist in the tone of the Fed might continue to push US long-term interest rates higher and put upward pressure on bond yields in the Eurozone.

Read more

Forex MAJORS

Cryptocurrencies

Signatures