|

EUR/USD Price Analysis: Euro bulls attack 1.0910 upside hurdle on softer Greenback

  • EUR/USD stays defensive as bulls struggle to justify a one-month-old falling wedge bullish chart formation.
  • Strong yields fail to impress US Dollar bulls amid market’s consolidation ahead of central bankers’ speeches at Jackson Hole.
  • 200-SMA, previous support line from May add to the upside filters.
  • Euro bears need validation from 1.0830 to retake control.

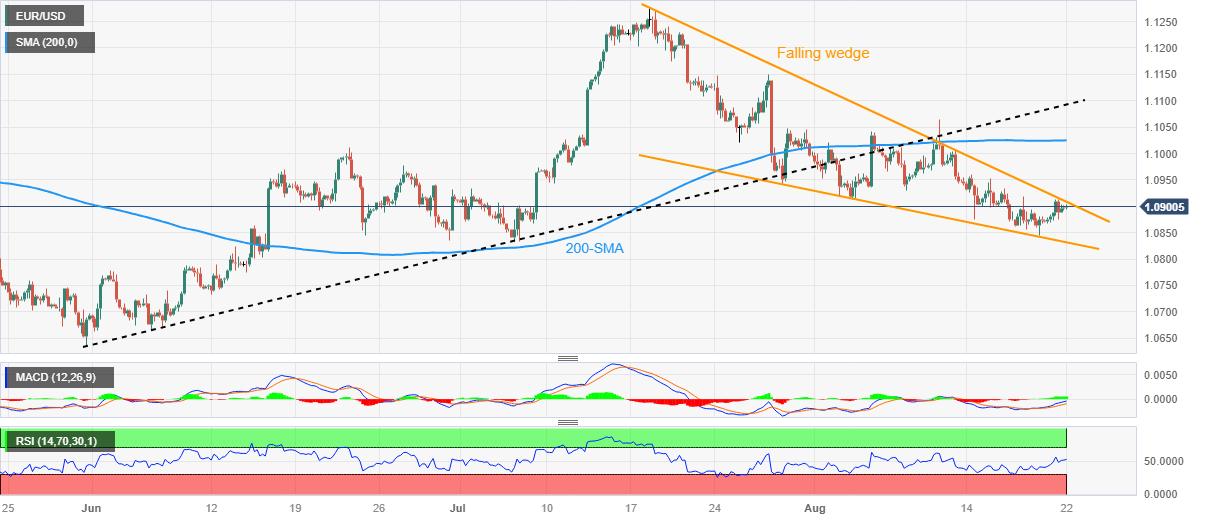
EUR/USD buyers flirt with the 1.0900 threshold within a one-month-long falling wedge bullish chart formation on early Tuesday.

The Euro pair’s latest moves could be linked to the market’s cautious mood ahead of this week’s top-tier data/events, as well as the recent fears emanating from the US banking sector. The same weighs on the US Dollar Index (DXY) even as the Treasury bond yields refresh a multi-year high.

Also read: US Dollar Index: DXY retreats towards 103.00 despite strong yields, focus on mid-tier US data, central bankers

That said, the upbeat RSI (14) line and the bullish MACD signals keep the EUR/USD buyers hopeful of confirming the falling wedge chart pattern suggesting a theoretical target of 1.1340.

However, successful trading beyond the stated wedge’s top line, around 1.0910 by the press time, becomes necessary for the bullish confirmation.

Even so, the 200-SMA and the previous support line stretched from May 31, respectively near 1.1025 and 1.1095, can prod the EUR/USD bulls.

On the contrary, a downside break of the stated wedge’s bottom line, close to 1.0830 at the latest, puts a floor under the Euro pair for the short term.

Following that, the early June’s swing high of around 1.0775-80 could lure the EUR/USD sellers.

EUR/USD: Four-hour chart

Trend: Further upside expected

additional important levels

Overview
Today last price1.0899
Today Daily Change0.0003
Today Daily Change %0.03%
Today daily open1.0896
 
Trends
Daily SMA201.096
Daily SMA501.098
Daily SMA1001.0931
Daily SMA2001.0794
 
Levels
Previous Daily High1.0914
Previous Daily Low1.0867
Previous Weekly High1.096
Previous Weekly Low1.0845
Previous Monthly High1.1276
Previous Monthly Low1.0834
Daily Fibonacci 38.2%1.0896
Daily Fibonacci 61.8%1.0885
Daily Pivot Point S11.087
Daily Pivot Point S21.0845
Daily Pivot Point S31.0824
Daily Pivot Point R11.0917
Daily Pivot Point R21.0939
Daily Pivot Point R31.0964

Author

Anil Panchal

Anil Panchal

FXStreet

Anil Panchal has nearly 15 years of experience in tracking financial markets. With a keen interest in macroeconomics, Anil aptly tracks global news/updates and stays well-informed about the global financial moves and their implications.

More from Anil Panchal
Share:

Markets move fast. We move first.

Orange Juice Newsletter brings you expert driven insights - not headlines. Every day on your inbox.

By subscribing you agree to our Terms and conditions.

Editor's Picks

EUR/USD eyes 1.1800 barrier near two-month highs

EUR/USD extends its gains for the second successive session, trading around 1.1780 during the Asian hours on Tuesday. On the daily chart, technical analysis indicates a persistent bullish bias, as the pair moves upward within the ascending channel pattern. Additionally, the 14-day Relative Strength Index at 68.89 sits near overbought, signaling strong demand. RSI remains elevated, which could cap gains if overbought conditions emerge.

GBP/USD knocks ten-week highs ahead of holiday slowdown

GBP/USD found room on the high side on Monday, kicking off a holiday-shortened trading week with a fresh spat of Greenback weakness, bolstering the Pound Sterling into its highest bids in ten weeks. Pound traders are largely brushing off the latest interest rate cut from the Bank of England as the UK’s central bank policy strategy leaves the water murky for rate-cut watchers.

Gold bulls seem unstoppable amid supportive fundamental backdrop

Gold is seen building on the previous day's strong rally of over 2% and continues scaling new all-time highs for the second consecutive day on Tuesday. The commodity climbs closer to the $4,500 psychological mark during the Asian session and remains well supported by a combination of factors. 

Uniswap holds above $6 as traders eye UNIfication vote outcome

Uniswap price holds above $6 at the time of writing on Tuesday after closing above a key resistance zone in the previous week. Traders are focusing on the highly anticipated UNIfication proposal, which is set to conclude on Thursday, and could become a key near-term catalyst. On the technical side, momentum indicators are flashing bullish signals, hinting at an upside rally.

Ten questions that matter going into 2026

2026 may be less about a neat “base case” and more about a regime shift—the market can reprice what matters most (growth, inflation, fiscal, geopolitics, concentration). The biggest trap is false comfort: the same trades can look defensive… right up until they become crowded.

XRP steadies above $1.90 support as fund inflows and retail demand rise

Ripple (XRP) is stable above support at $1.90 at the time of writing on Monday, after several attempts to break above the $2.00 hurdle failed to materialize last week. Meanwhile, institutional interest in the cross-border remittance token has remained steady.