EUR/USD Price Analysis: Euro bears attack 1.0690-85 key support as US data looms


Share:
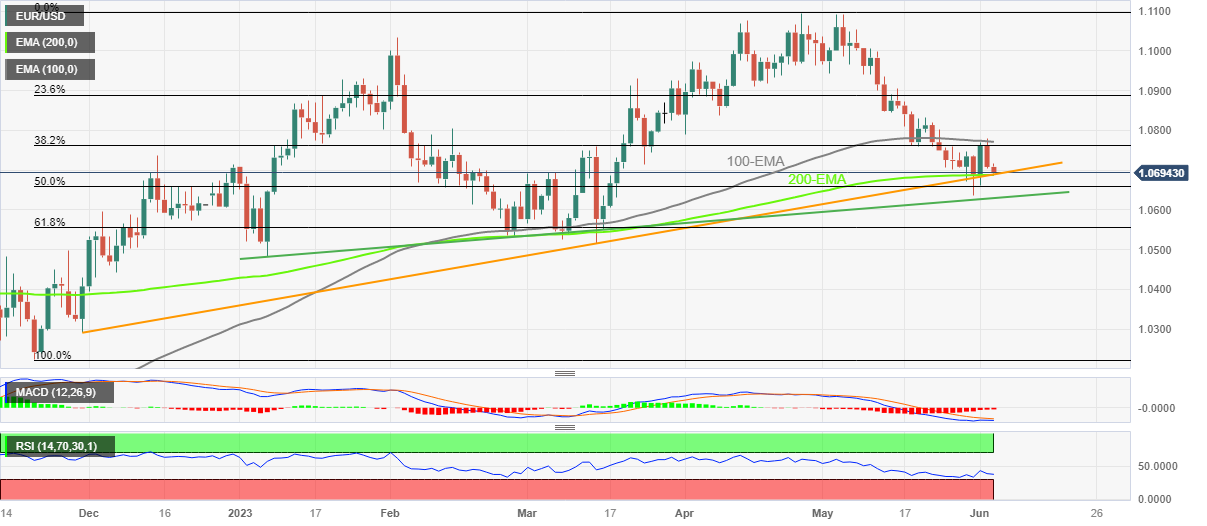
  • EUR/USD stays defensive as sellers flirt with 200-EMA, seven-month-old support line.
  • Looming bull cross on MACD, below-50.00 RSI conditions prod Euro bears.
  • Euro buyers need validation from 100-EMA to retake control.

EUR/USD remains pressured around the intraday low, making rounds to 1.0700 of late, as a short-term key support confluence challenges the Euro sellers amid Monday’s sluggish Asian session.

It’s worth noting that the broad US Dollar and downbeat concerns about the Eurozone keep the EUR/USD bears hopeful as traders await the US ISM Services PMI and Factory Orders.

Also read: EUR/USD stays depressed near 1.0700 ahead of US Factory Orders, ISM Services PMI

That said, the quote’s clear U-turn from the 100-day Exponential Moving Average (EMA), currently around 1.0770, allows the EUR/USD bears to prod a convergence of the 200-day EMA and an upward-sloping trend line from late November 2022.

It’s worth noting, however, that the receding bearish bias of the MACD and the nearly oversold RSI line, placed at 14, challenge the EUR/USD bears as they jostle with the key support near 1.0690-85.

Even if the quote drops below the 1.0690-85 support confluence, the 50% Fibonacci retracement of its November-April upside and a five-month-old rising support line, respectively near 1.0660 and 1.0635, can challenge the EUR/USD pair’s further downside.

Meanwhile, EUR/USD recovery needs to provide a daily closing beyond the 100-day EMA, around 1.0770 by the press time, to convince the buyers.

Even so, the lows marked during early April and May around 1.0840-50 can act as the last defense of the EUR/USD bears.

EUR/USD: Daily chart

Trend: Limited downside expected

Additional important levels

Overview
Today last price 1.0697
Today Daily Change -0.0011
Today Daily Change % -0.10%
Today daily open 1.0708
 
Trends
Daily SMA20 1.0813
Daily SMA50 1.0897
Daily SMA100 1.0813
Daily SMA200 1.0502
 
Levels
Previous Daily High 1.0779
Previous Daily Low 1.0705
Previous Weekly High 1.0779
Previous Weekly Low 1.0635
Previous Monthly High 1.1092
Previous Monthly Low 1.0635
Daily Fibonacci 38.2% 1.0733
Daily Fibonacci 61.8% 1.0751
Daily Pivot Point S1 1.0682
Daily Pivot Point S2 1.0657
Daily Pivot Point S3 1.0609
Daily Pivot Point R1 1.0756
Daily Pivot Point R2 1.0804
Daily Pivot Point R3 1.083


Share: Feed news

Information on these pages contains forward-looking statements that involve risks and uncertainties. Markets and instruments profiled on this page are for informational purposes only and should not in any way come across as a recommendation to buy or sell in these assets. You should do your own thorough research before making any investment decisions. FXStreet does not in any way guarantee that this information is free from mistakes, errors, or material misstatements. It also does not guarantee that this information is of a timely nature. Investing in Open Markets involves a great deal of risk, including the loss of all or a portion of your investment, as well as emotional distress. All risks, losses and costs associated with investing, including total loss of principal, are your responsibility. The views and opinions expressed in this article are those of the authors and do not necessarily reflect the official policy or position of FXStreet nor its advertisers. The author will not be held responsible for information that is found at the end of links posted on this page.

If not otherwise explicitly mentioned in the body of the article, at the time of writing, the author has no position in any stock mentioned in this article and no business relationship with any company mentioned. The author has not received compensation for writing this article, other than from FXStreet.

FXStreet and the author do not provide personalized recommendations. The author makes no representations as to the accuracy, completeness, or suitability of this information. FXStreet and the author will not be liable for any errors, omissions or any losses, injuries or damages arising from this information and its display or use. Errors and omissions excepted.

The author and FXStreet are not registered investment advisors and nothing in this article is intended to be investment advice.

Follow us on Telegram

Stay updated of all the news

Join Telegram

Recommended content


Follow us on Telegram

Stay updated of all the news

Join Telegram

Recommended content

Editors’ Picks

EUR/USD hits fresh daily lows under 1.0500

EUR/USD hits fresh daily lows under 1.0500

EUR/USD continued to face downward pressure and matched last week's low at 1.0487. It is hovering around 1.0500, as the US Dollar remains strong, supported by higher Treasury yields. The 10-year Treasury yield reached 4.70%, a level not seen since 2007.

EUR/USD News

GBP/USD drops to six-month lows, eyes 1.2100

GBP/USD drops to six-month lows, eyes 1.2100

GBP/USD retreated further and dropped to 1.2107, hitting the lowest since mid-April. The pair remains under pressure amid higher US Treasury yields, following better-than-expected ISM September Manufacturing PMI data.

GBP/USD News

Gold approaches $1,800 as demand for the USD prevails Premium

Gold approaches $1,800 as demand for the USD prevails

Spot Gold fell to a fresh multi-month low of $1,827.11 a troy ounce on Monday amid resurgent  US Dollar demand. The Greenback suffered a minor setback at the beginning of the week, as generally encouraging Chinese data and upbeat United States (US) news underpinned the mood.

Gold News

Three altcoins that have kickstarted Q4 rally: LINK, RDNT, FLOKI

Three altcoins that have kickstarted Q4 rally: LINK, RDNT, FLOKI

Crypto market volatility seems to be making a comeback with the start of 2023’s fourth quarter , and some altcoins are already making headway. Chainlink (LINK), Radiant Capital (RDNT) and Floki Inu (FLOKI) are some cryptos that are showing aggressive upside moves. 

Read more

NIO contracts 2% as Tesla delivery decline weighs on EV sector

NIO contracts 2% as Tesla delivery decline weighs on EV sector

Nio (NIO) stock dropped 2.3% on Monday morning despite meeting its quarterly delivery target for the third quarter. Tesla's (TSLA) Q3 production and delivery decline is the culprit.

Read more

Forex MAJORS

Cryptocurrencies

Signatures