|

EUR/USD Price Analysis: Dribbles around 0.9830 support near 19-year low

  • EUR/USD holds lower ground at the two-decade low, prints three-day downtrend.
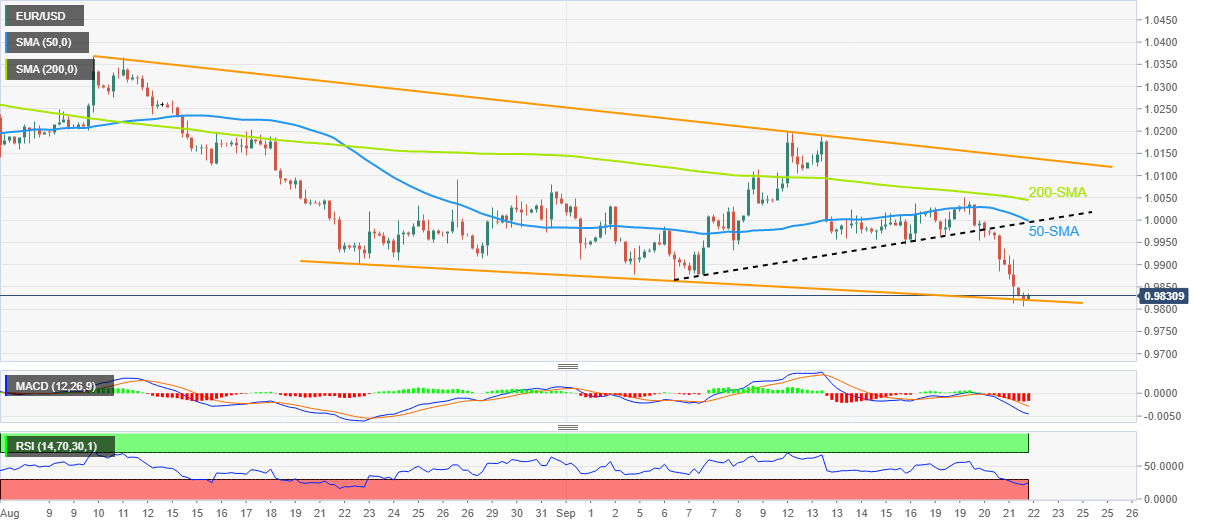
  • Short-term support line, 61.8% FE joins oversold RSI (14) to trigger corrective bounce.
  • Recovery remains elusive below parity level, sellers could aim for the 2002 low.

EUR/USD licks its wounds near the lowest levels since October 2002, picking up bids to 0.9830 heading into Thursday‘s European session. In doing so, the major currency pair consolidates the biggest daily losses in a week, mainly inspired by the US Federal Reserve (Fed), as market players await a slew of other central bank announcements.

That said, 61.8% Fibonacci Expansion (FE) of the pair’s June-September moves joins a one-month-old descending trend line and the oversold RSI to challenge EUR/USD bears around 0.9830.

However, a convergence of the previous support line from September 06 and the 50-SMA, around the 1.0000 parity level, could keep challenging the EUR/USD pair’s recovery moves.

Also acting as the upside hurdle is the 200-SMA and a six-week-long falling trend line, respectively near 1.0045 and 1.0140.

It’s worth noting that the EUR/USD pair’s run-up beyond 1.0140 will need validation from the monthly high near 1.0200 to convince buyers.

Alternatively, a downside break of the 0.9830 support won’t hesitate to direct EUR/USD bears towards the year 2002 low near 0.9610.

EUR/USD: Four-hour chart

Trend: Further weakness expected

EUR/USD

Overview
Today last price0.9829
Today Daily Change-0.0008
Today Daily Change %-0.08
Today daily open0.9837
 
Trends
Daily SMA200.9985
Daily SMA501.0091
Daily SMA1001.0299
Daily SMA2001.0711
 
Levels
Previous Daily High0.9976
Previous Daily Low0.9813
Previous Weekly High1.0198
Previous Weekly Low0.9945
Previous Monthly High1.0369
Previous Monthly Low0.9901
Daily Fibonacci 38.2%0.9876
Daily Fibonacci 61.8%0.9914
Daily Pivot Point S10.9775
Daily Pivot Point S20.9713
Daily Pivot Point S30.9612
Daily Pivot Point R10.9938
Daily Pivot Point R21.0039
Daily Pivot Point R31.0101

Author

Anil Panchal

Anil Panchal

FXStreet

Anil Panchal has nearly 15 years of experience in tracking financial markets. With a keen interest in macroeconomics, Anil aptly tracks global news/updates and stays well-informed about the global financial moves and their implications.

More from Anil Panchal
Share:

Editor's Picks

AUD/USD falls to near 0.7100 after slipping below 50-day EMA

AUD/USD depreciates after registering minor gains in the previous day, trading around 0.7120 during the Asian hours. The technical analysis of the daily chart shows the pair consolidating sideways within a rectangle pattern, as neither bulls nor bears gain control. The AUD/USD pair is holding a slight bearish tone however as it sits beneath both the nine-day and 50-day EMAs.

160.00: USD/JPY back near intervention territory after upbeat US jobs report

US Nonfarm Payrolls beat expectations by a wide margin in May, with 172K jobs added. The US Dollar rebounds after the release, helping USD/JPY recover from its intraday lows. Warnings from Japanese authorities continue to limit upside potential near the 160.00 threshold.

Gold targets $4,300 amid stronger Dollar

Gold faces increasing selling interest and navigates the area of three-month lows near the $4,300 mark per troy ounce on Friday. The precious metal’s decline comes as traders assess the stronger-than-expected NFP, while the bid bias in the Greenback and higher US Treasury yields also collaborate with the retracement.

Cardano hits five-year low even as Hoskinson clarifies "break" isn't an exit

Cardano (ADA) price is down 10% at press time on Friday, extending losses over 30% so far this week amid Charles Hoskinson's clarification that "break" isn't an exit.

Week ahead – Fed countdown begins amid US inflation data and geopolitical risks

Fed Chair Warsh’s first meeting approaches as key US inflation data could reshape expectations. Oil prices remain elevated as US-Iran talks continue; tariffs also return to the spotlight. ECB is expected to hike; will it be a one-off move or is July live?

The US economy defies the rules: 100 days into the Oil shock and the recession signal is still missing

More than three months after the start of the Iran war and the resulting disruption to global energy markets, the US economy continues to display remarkable resilience. The conflict has triggered a sharp rise in Oil prices, reignited inflationary pressures and fueled widespread concerns about a potential economic slowdown.